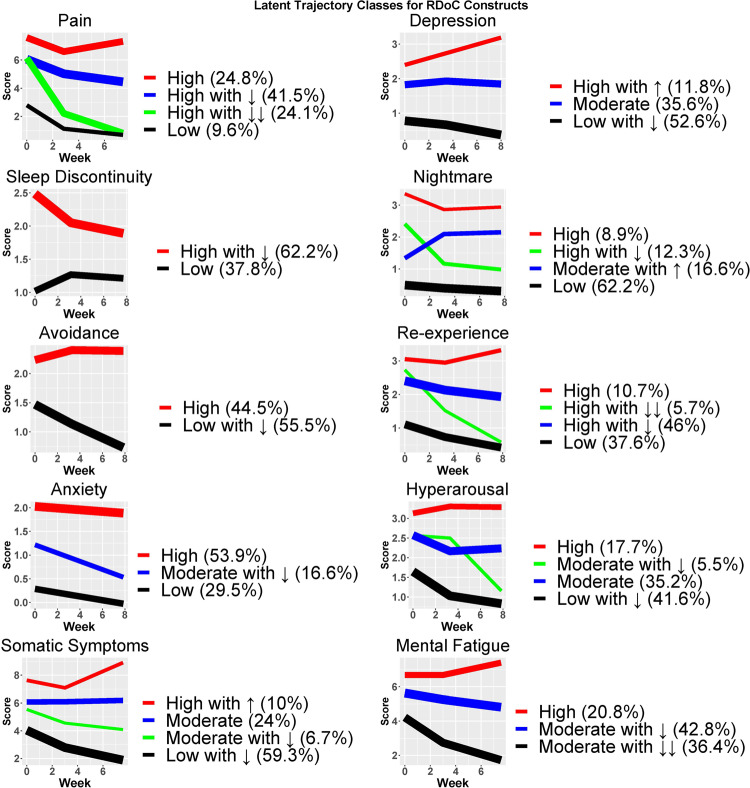
Fig. 1. Common posttraumatic symptom trajectories during the eight weeks after motor vehicle collision (MVC).
Common trajectories within each symptom domain were identified using latent growth curve mixture models developed from measurement models created using serial assessments of each symptom domain. (Each domain assessed six times in the first eight weeks after MVC.) Percentages within the legend for each symptom domain represent the percentage of trauma survivors within each latent class. The thickness of the lines represents the proportion of participants in each latent cluster. ↓: decreasing over time, ↓↓: major decrease over time, ↑: increasing over time.

