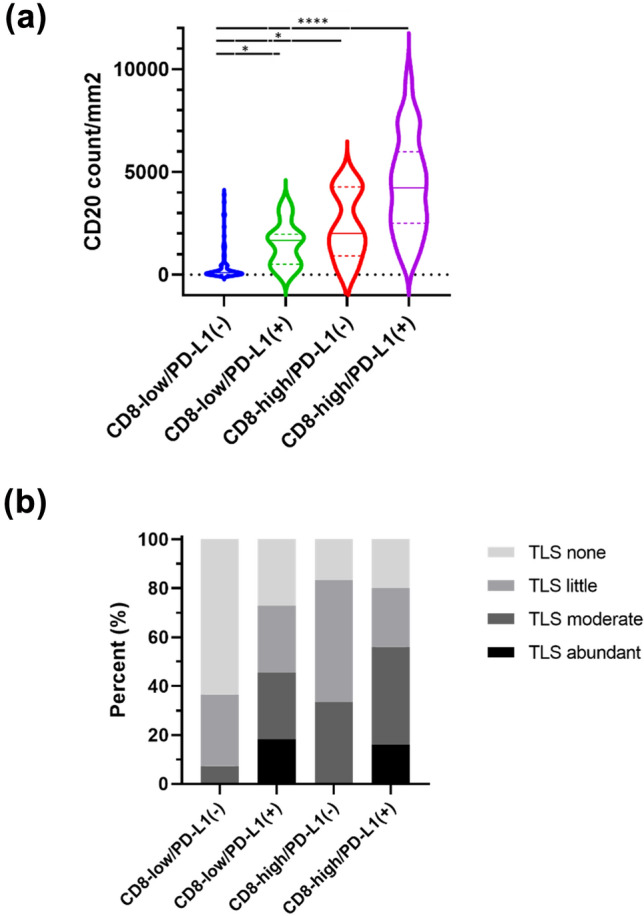
Fig. 3.

CD20 positive cells and TLS between four immune subtypes based on CD8 and PD-L1. Violin plots of CD 20 positive cells (a) in patients with low CD8/PD-L1(−) (blue), high CD8/PD-L1(−) (red), low CD8/PD-L1( +) (green), and high CD8/PD-L1( +) (purple). The bars represent the first, median, and third quartile values. *p < 0.05, ****p < 0.0001. b Association between TLS amount and immune subtypes. Abbreviations: PD-L1, programmed cell death-ligand 1; TLS, tertiary lymphoid structure
