
Fig. 1.
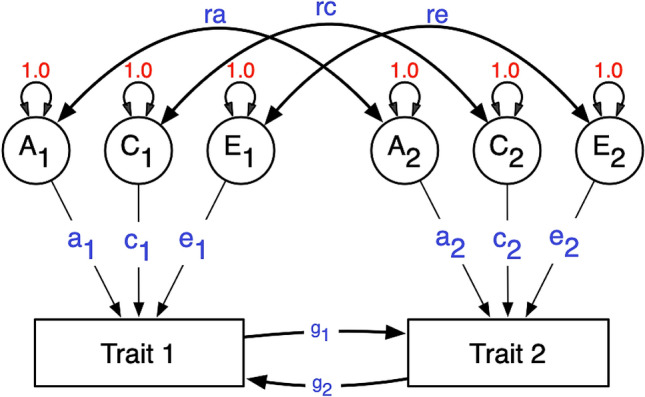
Classic DoC model. Path diagram representing a Direction of Causation model for one twin. This is depicting the relationship between two phenotypes, and the causal paths are estimated affording information from the cross-twin cross-trait correlations. Cross-twin covariance between additive genetic effects is 0.5 (not shown) for DZ twins, as DZs are expected to share 50% of the genetic effects. Standard structural equation modeling symbology is used. Circles represent latent variables, whose variances are fixed to unity. Double-headed arrows are covariances or variances, single-headed are the causal regression paths. Squares represent observed variables. A, C and E are the additive, shared and unique environmental effects. This model is not identified with data from MZ and DZ twins. To make it identified one needs to set to zero any two of the five paths ra, rc, re, g2 and g1 (Maes et al. 2021)