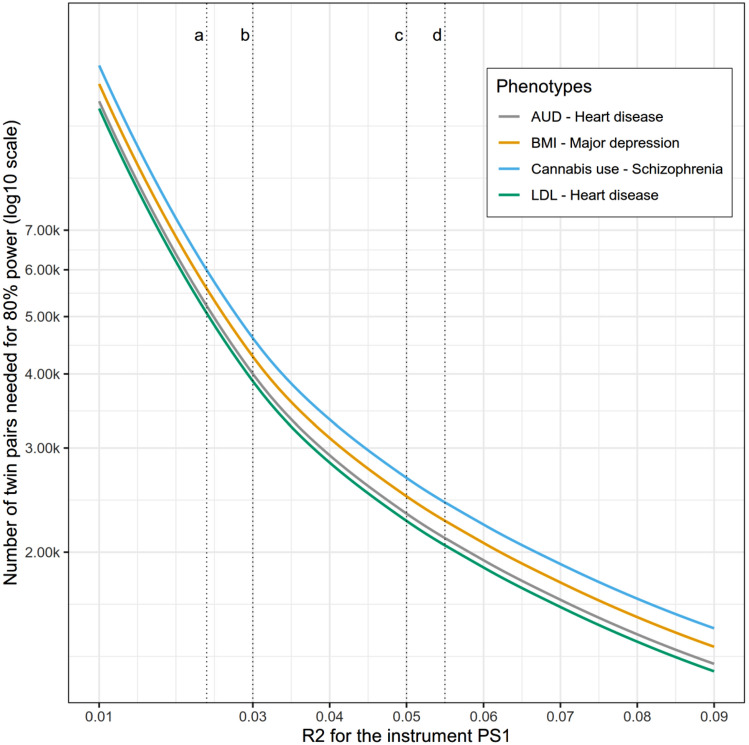
Fig. 3.
Power curve across R² values for PS1. Parameters set for all groups b3 = g1 = g2 = , ra = 0.3; rc = 0.25; re = 0.3; rf = 0.25; Environmental variances were dependent on shared and additive genetic variances: e1 was specified as and e2 as . Additive and shared variances for the groups: (A) cannabis use (a2 51%, c2 20%) (Verweij et al. 2010) and schizophrenia (a2 81%, c2 11%) (Sullivan et al. 2003); (B) BMI (a2 72%, c2 3%) (Rokholm et al. 2011) and major depression (a2 37%, c2 1%) (Scherrer et al. 2003); (C) alcohol use (a2 49%, c2 10%) (Verhulst et al. 2015) and heart disease (a2 22%, c2 0%) (Wu et al. 2014); (D) dyslipidemia (LDL) (a2 60%, c2 28%) (Zhang et al. 2010) and heart disease (a2 22%, c2 0%) (Wu et al. 2014). Vertical lines were added to represent R2 for four PSs reported in recent papers: a, smoking (Pasman et al. 2022); b, BMI (Furlong and Klimentidis 2020); c, LDL (Kuchenbaecker et al. 2019); d, attention deficit hyperactivity disorder (ADHD) (Demontis et al. 2019)

