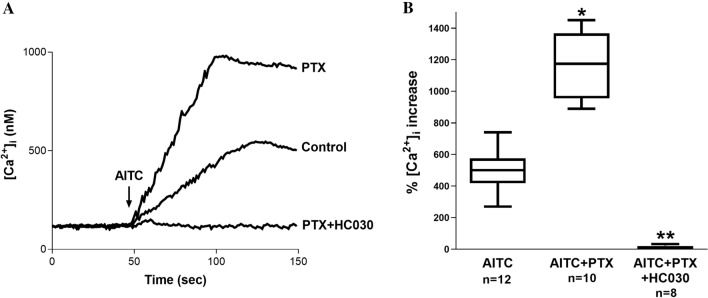
Fig. 4.
A Representative recordings of intracellular Ca2+ concentration in Fura-2-loaded SH-SY5Y cells under steady-state conditions and following AITC treatment in the presence of PTX and PTX + HC-030. Fluorescence was recorded for 150 s. The arrow indicates the moment in which AITC was added to the external solution. B Comparison between the mean maximal AITC-induced intracellular Ca2+ increase percentage in Fura-2-loaded SH-SY5Y cells, in the presence of PTX and PTX + HC-030. n is indicated in each case. *Denotes a significant decrease (p = 0.01) in comparison to the control

