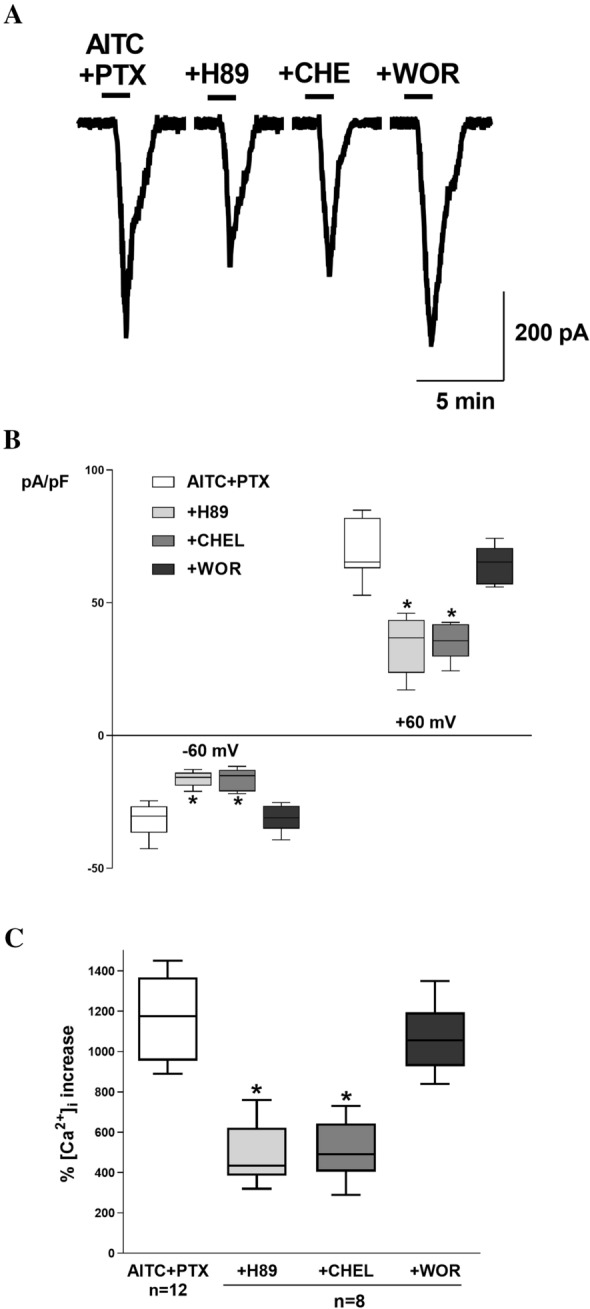
Fig. 5.

A Typical current (I) recording at − 60 mV in the presence of AITC + PTX and H89, chelerythrine (CHE) or wortmannin (WOR), as indicated. B Comparison between the mean maximal normalized current recorded at − 60 mV and + 60 mV under the same conditions described in A. n = 8 in all cases C. Comparison between the mean maximal intracellular Ca2+ increase percentage in Fura-2-loaded SH-SY5Y cells, in the presence of PTX + AITC under the same conditions described in A and B. n is indicated in each case. *Denotes a significant decrease (p = 0.01) in comparison to the control
