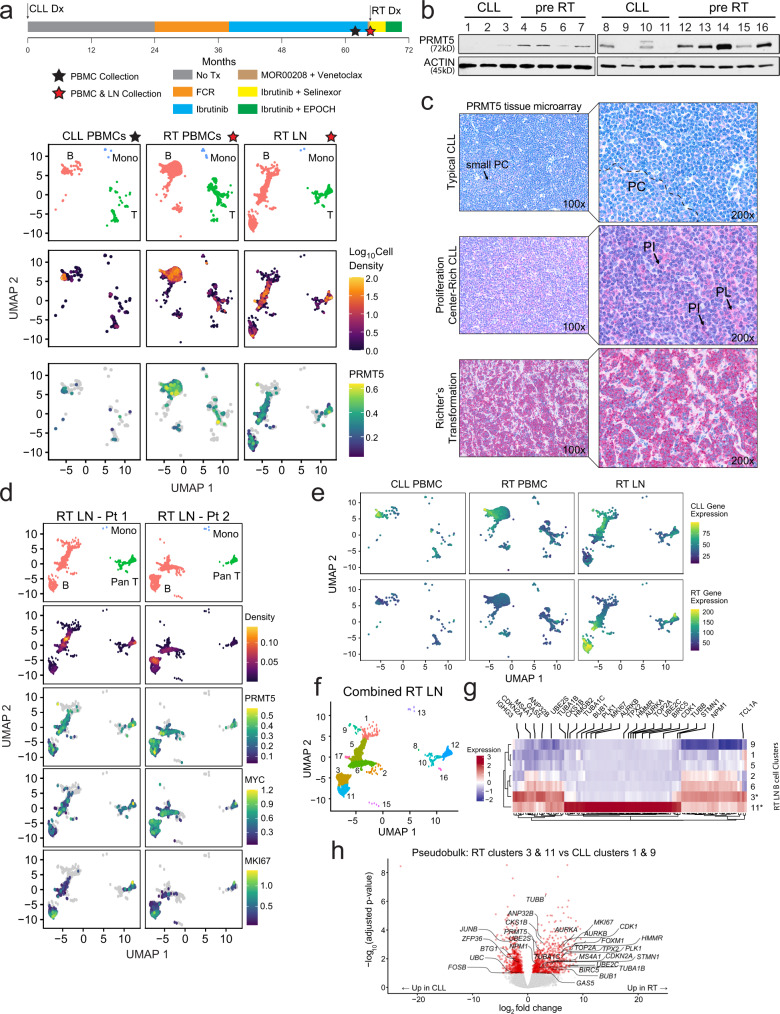
Fig. 1. PRMT5 is overexpressed in RT and in CLL undergoing RT.
a Patient 1 (Pt 1) timeline. ScRNA-seq UMAP plots stratified by disease/tissue visualizing cell type clusters, local log10(cell density), and PRMT5 expression. Cell density color scale is shown as the Log10-transformed cell count within hexagonal bins. PRMT5 expression is shown as the Log10-transformed expression where expression is size factor normalized UMI counts. b PRMT5 expression in CLL B cells via western blot. Patient samples were collected during the CLL-phase (n = 16) and retrospectively identified as those eventually progressing (pre-RT) or not (CLL) to RT within one year from the time of collection. c Representative PRMT5 staining by tissue microarray in lymph node biopsies from 70 CLL cases (typical distribution of proliferation centers or proliferation center-rich) and 15 RT cases. PL prolymphocytes, PI paraimmunoblasts. d ScRNA-seq of two RT patient tumors collected at the time of RT diagnosis. UMAP plots stratified by RT patient LN biopsy sample visualizing cell type clusters; cell density; and expression of PRMT5, MYC, and MKI67. Cell types were assigned by cell type markers, Supplemental Fig. 1B. Cell density is calculated as the 2d kernel density estimate mapped to color scale. Gene expression is shown as the Log10-transformed expression where expression is size factor normalized UMI counts. e Aggregate gene expression of CLL and RT-specific genes identified from literature (Nadeu et al. 2022, Supplemental Table 11b)31 in longitudinal samples (Pt 1). Expression is shown as the Log10-transformed size factor normalized UMI counts scaled for each gene module. f RT Pt 1 and Pt 2 nodal cells with Leiden clusters distinguished by color and number. g Heatmap highlighting the top 50 enriched genes in RT-specific nodal B-cell clusters 3 and 11, from Pt 1 and Pt 2 shown in (d, f). Gene expression across 100 genes is shown as the average Log10-transformed expression in nodal B-cell clusters. Genes associated with leukemia and lymphoma are highlighted. h Pseudobulk differential gene expression between RT LN (3 & 11) and CLL (1 & 9) enriched B-cell clusters. Highlighted genes have adjusted P value <0.1 and fold change >1.5. Source data are provided as a Source Data file.

