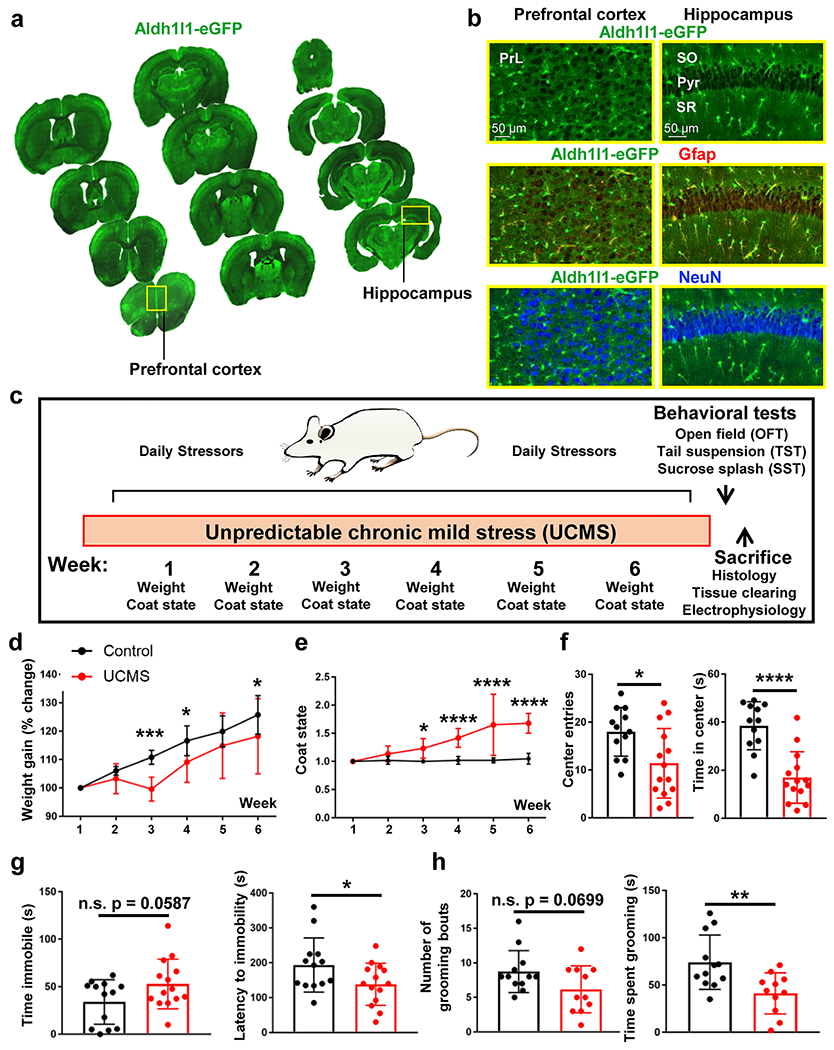
Figure 1: Aldh1l1-eGFP mouse and Unpredictable Chronic Mild Stress paradigm.

(a) Coronal mouse brain sections from one Aldh1l1-eGFP. 30 μm thick tissue sections were mounted on slides at ~500 μm intervals to demonstrate transgene expression throughout the rostral-caudal and dorsal-ventral axis of the brain. Abbreviations: PrL = prelimbic cortex. (b) 20X representative images of the Aldh1l1-eGFP transgene in both the prefrontal cortex (left panel) and hippocampus (right panel). Note that Aldh1l1-eGFP positive cells co-localize with the astrocytic marker GFAP, but not with the neuronal marker NeuN. Abbreviations: SO = stratum radiatum; Pyr = pyramidal cell layer; SR = stratum radiatum (c) Schematic outline of the six-week Unpredictable Chronic Mild Stress (UCMS) paradigm. (d) Percent change in weight over the six-week UCMS paradigm in control (black line) and UCMS (red line) mice. Data were analyzed using ANOVA, followed by post-hoc tests. (e) Graphical representation of coat/fur state across the six-week UCMS paradigm. Data were analyzed using ANOVA, followed by post-hoc tests. (f) Graphical representation of number of center entries (left panel) and total time spent in the center or the arena (right panel) in the open field test. Data were analyzed using Student’s t-test. g) Graphical representation of the amount of time spent immobile (left panel) and the latency to the first immobility (right panel) in the tail suspension test. Data were analyzed using Student’s t-test. (h) Graphical representation of the number of total grooming bouts (left panel) and the amount of time spent grooming (right panel) in the sucrose splash test. Data were analyzed using Student’s t-test. *: p < 0.05; **: p < 0.01; ***: p < 0.001; ****: p < 0.0001; n.s.: not significant. N = 11-14 animals per condition.
