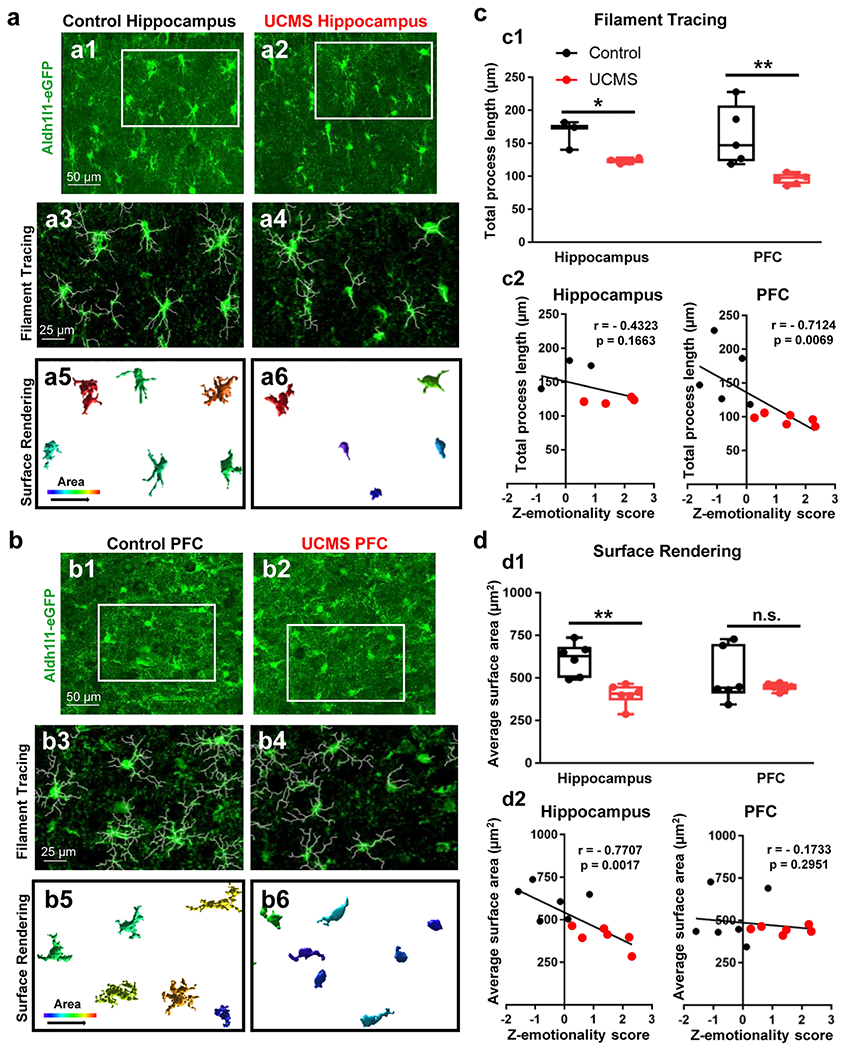
Figure 2: Changes in astrocyte morphology after UCMS.

(a1-a2) Representative 40X confocal images of Aldh1l1-GFP transgene in the hippocampus of a control (left panel) and stressed animal (right panel). The regions boxed in white reflect the same areas depicted in ‘a3-a4’. (a3-a4) Imaris filament tracing of astrocyte processes from a control (left panel) and UCMS (right panel) animal. (a5-a6) Imaris 3D-surface rendering of the same astrocytes depicted in ‘a1-a4’. Note the relative increase in area of astrocytes in the control section relative to the UCMS section. (b1-b2) Representative 40X confocal images of Aldh1l1-GFP transgene in the PFC of a control (left panel) and stressed animal (right panel). The regions boxed in white reflect the same areas depicted in ‘b3-b4’. (b3-b4) Imaris filament tracing of astrocyte processes from the PFC of a control (left panel) and UCMS (right panel) animal. (b5-b6) Imaris 3D-surface rendering of the same astrocytes depicted in ‘b1-b4’. (c1) Graphical analysis of Imaris filament tracing in hippocampal and PFC astrocytes from control animals (black) and UCMS animals (red). The average total astrocyte process length for each animal (analyzed from 3-4 images) is represented by each dot. Data were analyzed using Student’s t-test. *: p < 0.05; **: p < 0.01. N = 3-6 animals per stress condition. (c2) Graphical representation of correlations between average astrocyte process length (from hippocampal astrocytes: left panel and PFC astrocytes: right panel) and Z-emotionality behavioral scores. Correlations were analyzed using mice from both control (black dots) and UCMS (red dots) mice. A one-tailed Pearson analysis (using the ‘R correlation coefficient’) was used. N = 3-6 animals per condition. (d1) Graphical analysis of average astrocyte area (using Imaris 3D surface rendering) in hippocampal and PFC astrocytes from control animals (black) and UCMS animals (red). The average total astrocyte process area for each animal (analyzed from 3-4 images) is represented by each dot. Data were analyzed using Student’s t-test. **: p < 0.01; n.s.: not significant. N = 6 animals per stress condition. (d2) Graphical representation of correlations between average astrocyte process area (from hippocampal astrocytes: left panel and PFC astrocytes: right panel) and Z-emotionality behavioral scores. Correlations were analyzed using mice from both control (black dots) and UCMS (red dots) mice. A one-tailed Pearson analysis (using the ‘R correlation coefficient’) was used. N = 6 animals per condition.
