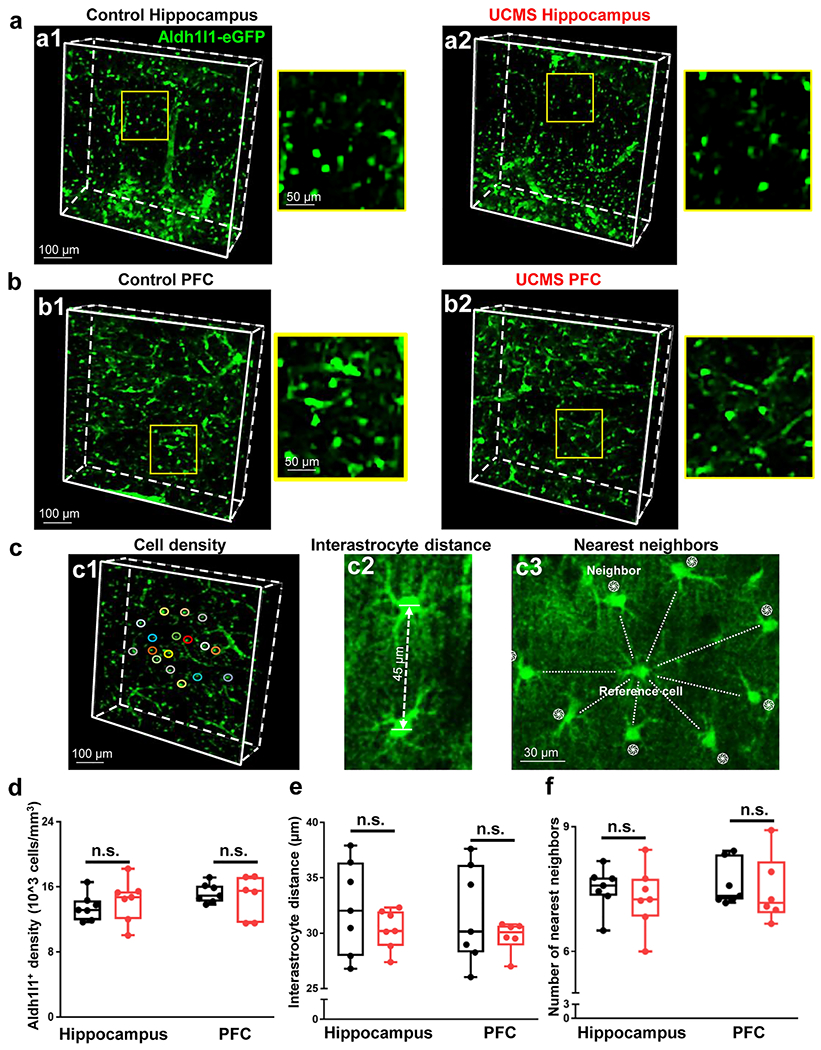
Figure 3: CUBIC tissue clearing in hippocampus and PFC of Aldh1l1-eGFP animals.

(a1-a2) Representative 10X CUBIC tissue clearing in the hippocampus of a control (left panel) and UCMS (right panel) animal. Note that the yellow box in the larger panels approximate the locations of the zoomed-in images on the right. (b1-b2) Representative 10X CUBIC tissue clearing in the PFC of a control (left panel) and UCMS (right panel) animal. (c1) Representation of astrocyte syncytial cell density analysis, interastrocyte distance (c2), and nearest neighbors (c3). (d) Graphical representation of the density of Aldh1l1-eGFP positive cells in the hippocampus (left) and PFC (right) of control and stressed animals. Data was analyzed from 6-7 animals per condition using Student’s t-test. (e) Graphical representation of the interastrocyte distance (i.e., the distance between astrocytes) in the hippocampus (left) and PFC (right) of control and stressed animals. (f) Graphical representation of the number of neighboring astrocytes nearest to the reference cell/astrocyte. Data was analyzed from 6-7 animals per condition using Student’s t-test. n.s.: not significant.
