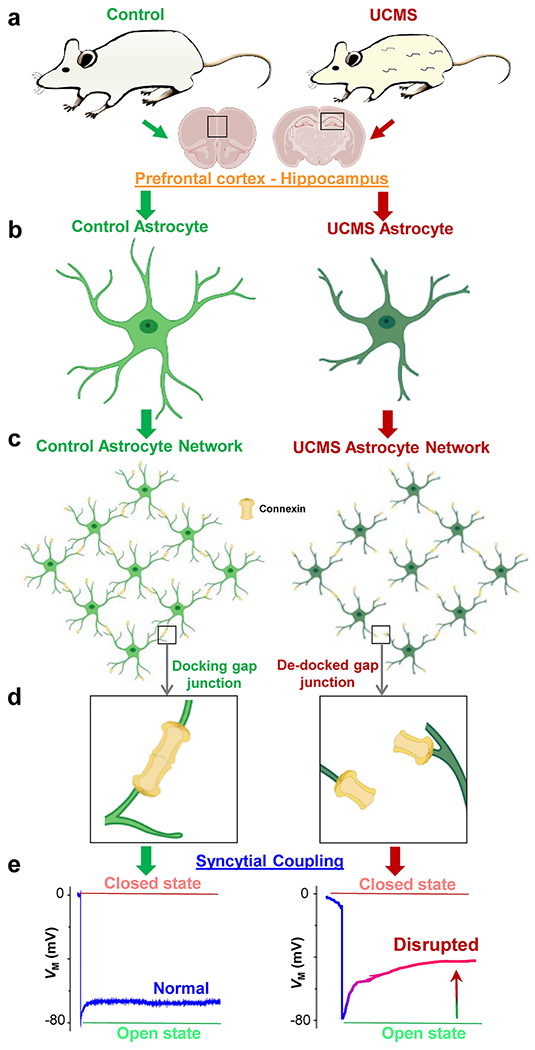
Figure 7: Schematic overview and hypothesized model of gap junction coupling after UCMS.

(a) Representative cartoon images of a control (left panel) and UCMS (right panel) mouse. Note the discoloration and tufts in the fur of the UCMS animal after the six-week stress paradigm. Information depicted in the schematic (and in the paper) was obtained from astrocytes within two brain regions: the prefrontal cortex (PFC) and the hippocampus. (b-c) Representation of control (light green) and UCMS (dark green) astrocyte morphology (both individual and network-level). Note the shrinkage of astrocytic processes from UCMS mice. Connexins are represented in yellow. (d) Hypothesized mechanism of gap junction coupling: unlike connexins in astrocytic processes from control animals (left panel) which successfully dock, connexins from astrocyte processes of UCMS animals may not be able to properly ‘dock’ (i.e., many connexins ‘de-dock’), leading to weakened coupling. (e) Representation of the electrophysiological readout (based on our recorded results) of syncytial coupling strength in astrocytes from the PFC and hippocampus of control (left panel) and UCMS (right panel) animals. Note the decreased coupling strength in astrocytes from UCMS mice. PFC and hippocampus brain sections, astrocytes, and connexins were created with BioRender software.
