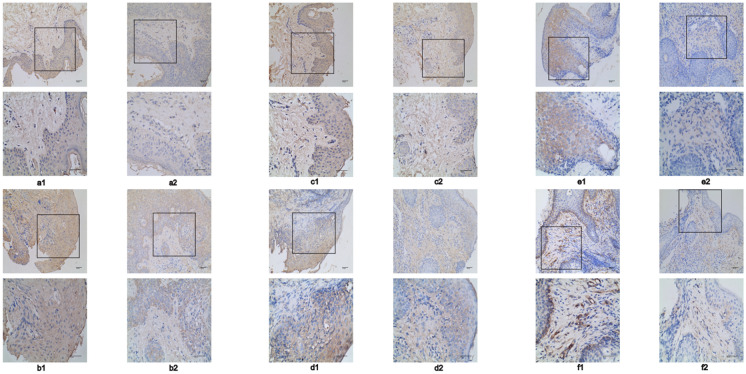
Fig. 3.
a1–a2 IL-1a, IL-6, IL-17, TGF-β, TLR-2 expression with intense staining before 30% SSA treatment; IL-1a with weaker staining after 30% SSA treatment (IHC, ×200; IHC, ×400). b1–b2 IL-6 expression with intense staining before 30% SSA treatment; IL-6 with weaker staining after 30% SSA treatment (IHC, ×200; IHC, ×400). c1–c2 IL-17 expression with intense staining before 30% SSA treatment; IL-17 with weaker staining after 30% SSA treatment (IHC, ×200; IHC, ×400). d1–d2 TGF-β expression with intense staining before 30% SSA treatment; TGF-β with weaker staining after 30% SSA treatment (IHC, ×200; IHC, ×400). e1–e2 TLR-2 expression with intense staining before 30% SSA treatment; TLR-2 with weaker staining after 30% SSA treatment (IHC, ×200; IHC, ×400). f1–f2 Caveolin-1 expression with weaker staining before 30% SSA treatment; caveolin-1 with intense staining after 30% SSA treatment (IHC, ×200; IHC, ×400). IHC immunohistochemistry, SSA supramolecular salicylic acid, IL interleukin, TGF- β transforming growth factor beta, TLR-2 toll-like receptor 2

