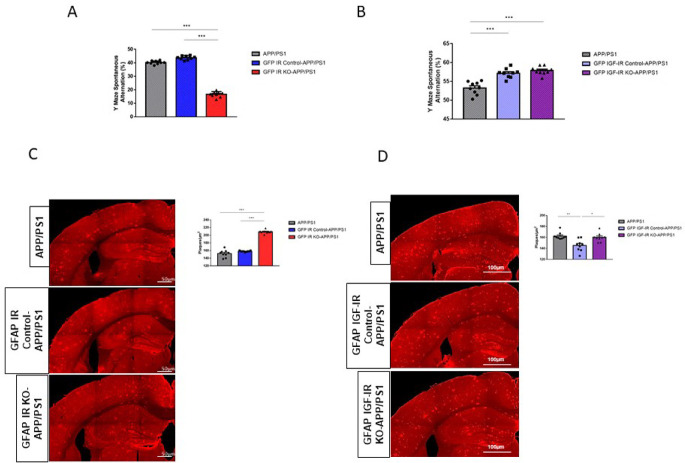
Figure 5. Modulation of Alzheimer´s-like pathology in GFAP IR KO/APP-PS1 and GFAP IGF-IR KO/APP-PS1 mice.
A, Performance in the working memory version of the Y maze was impaired in GFAP IR KO APP/PS1 mice (n=8 per group; One-way ANOVA, F=73.23; ***p<0.001; Tukey’s Multiple comparison test, APP/PS1 vs. GFP IR KO-APP/PS1: ***p<0.001, GFP IR Control-APP/PS1 vs. GFP IR KO-APP/PS1: ***p<0.001). B, Working memory determined in the Y maze remained unaltered in GFAP IGF-IR KO APP/PS1 mice and controls (n=8 per group; One-way ANOVA, F=2.9; p=0.07). C, Amyloid plaques in the parietal cortex and hippocampus in GFAP IR KO/APP-PS1 mice and controls. Representative photomicrographs showing amyloid plaques (red). Histograms show number of plaques/μm 2 in three experimental groups (n=8 per group; One-way ANOVA, F=25.78; ***p<0.001; Tukey’s Multiple comparison test, APP/PS1 vs. GFP IR KO-APP/PS1: ***p<0.01, GFP IR Control-APP/PS1 vs. GFP IR KO-APP/PS1: ***p<0.001). D, Amyloid plaques in the parietal cortex and hippocampus in GFAP IGF-IR KO/APP-PS1 mice and controls does not show differences between groups. Representative photomicrographs showing amyloid plaques (red). Histograms show number of plaques/μm 2 in the three experimental groups (n=8 per group; One-way ANOVA, F=1.35; p=0.32). IR=insulin receptors, GFAP=glial fibrillary astrocytic protein.

