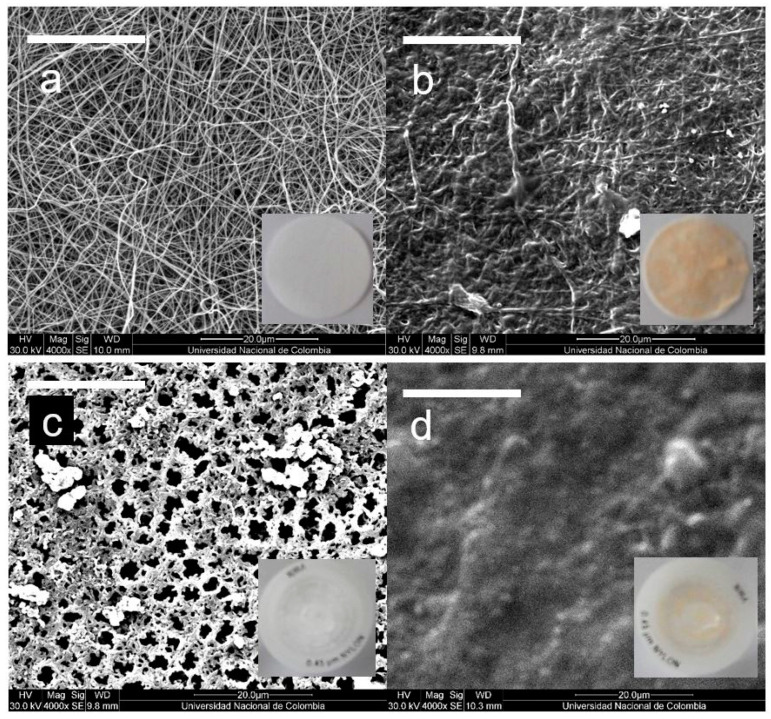
Figure 3.
SEM images of the typical morphology of NFM (a) before and (b) after filtration, compared to the typical morphology of CM (c) before and (d) after filtration. In the inserts, the corresponding macroscopic appearance of the filters. Filtration conditions: 10 mL of grapefruit juice (pink variety). White bars correspond to 20 μm.

