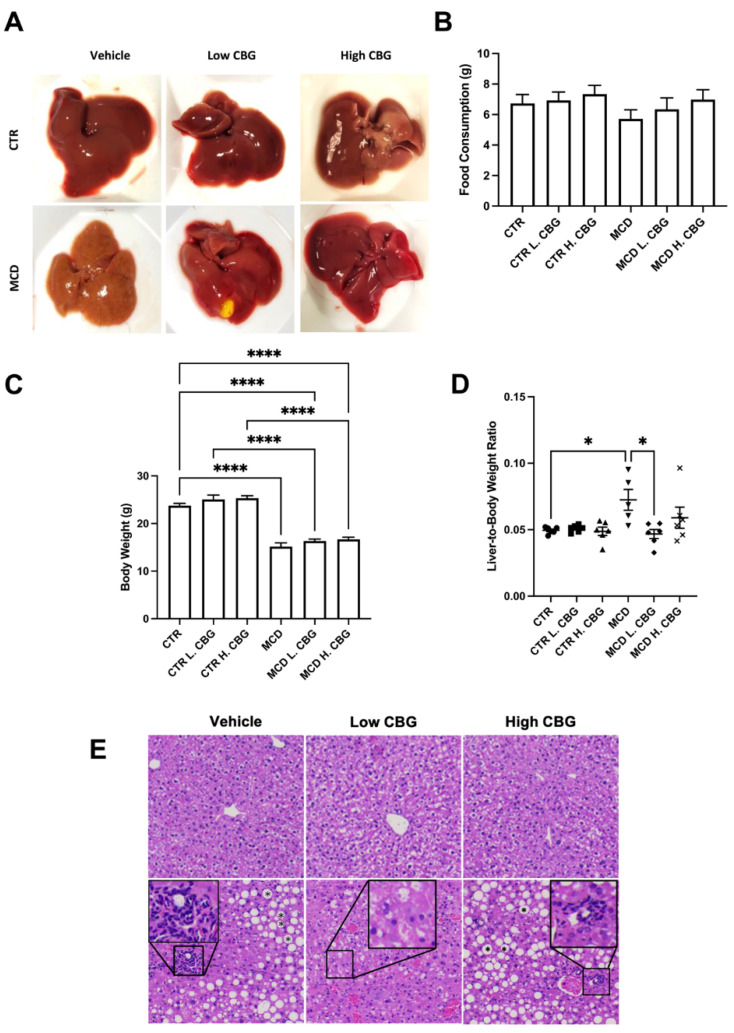
Figure 1.
Evaluation of the overall liver health with the induction of NASH using MCD diet and role of CBG in reducing the liver damage. Representative images of liver post-harvest to illustrate the differences in morphologies between groups (A) Average total food consumption (B), Body Weight (C) and average liver weight-to-body weight ratio (D) was calculated among groups. Representation of the liver after being stained with H&E (E), showing lipid accumulation (mark as asterisk in hepatic ballooning area) and white blood cells infiltration (enlarged area) with the MCD diet (bottom row). * p < 0.05, **** p < 0.0001.

