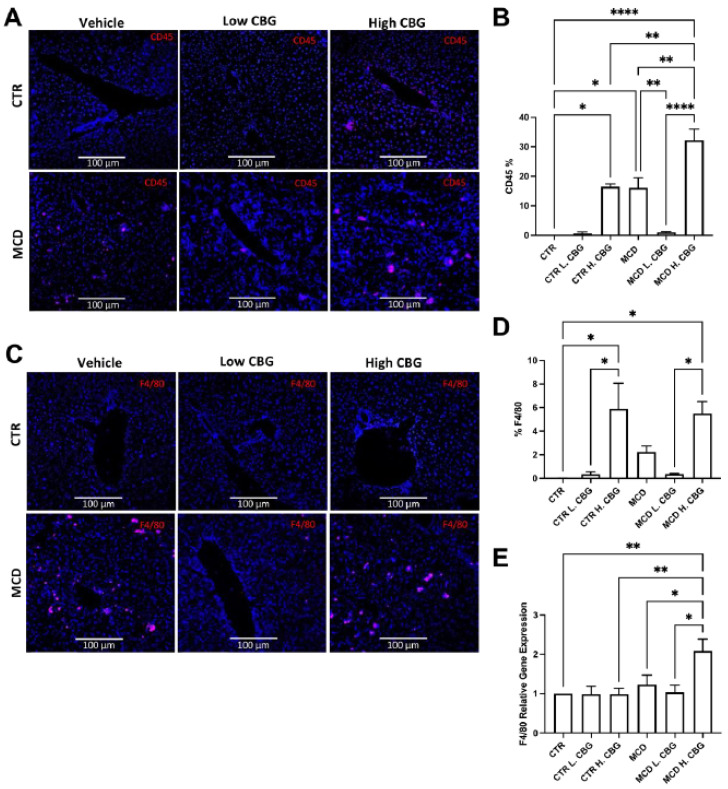
Figure 3.
Immunofluorescence staining and RT-qPCR were utilized to measure inflammation in liver tissues. Representative image of liver frozen sections stained for white blood cells showing CD45 in red and DAPI in blue (A, 20×), which was quantified using ImageJ (B). The infiltration of macrophages (F4/80+) were shown in red, while nuclei were shown in blue by DAPI staining (C). Images of F4/80 was also quantified using ImageJ (D). Quantification of mRNA expression of F4/80 (E). * p < 0.05, ** p < 0.01, **** p < 0.0001.

