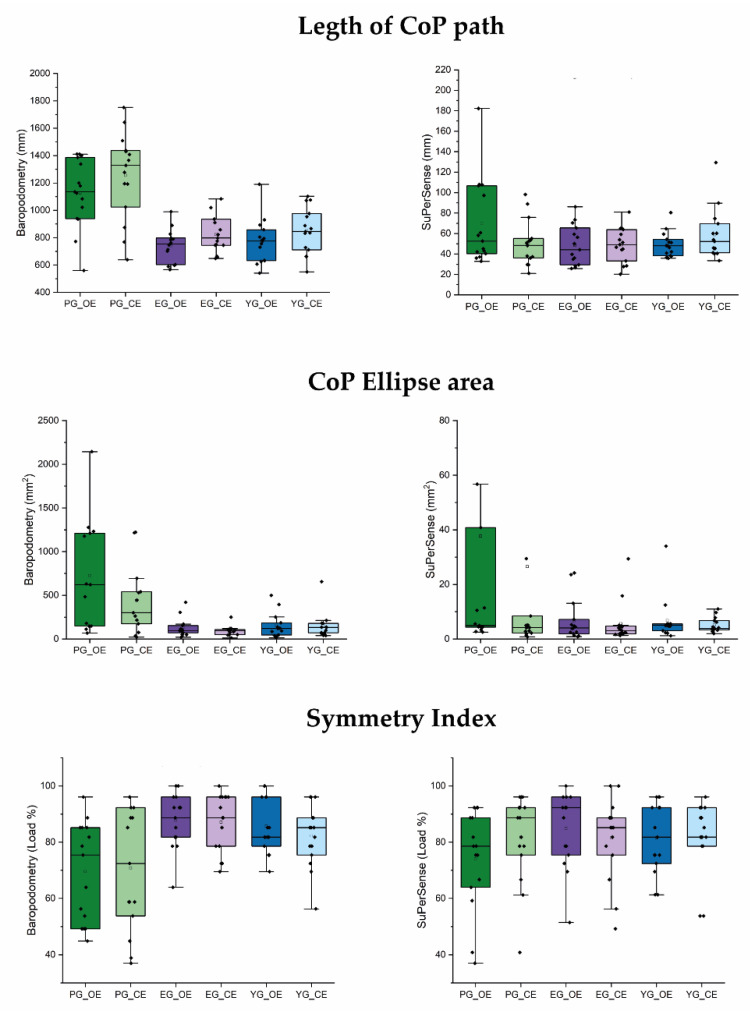
Figure 2.
Box plot figure. Each left panel is the specific index measured with baropodometric force plate, and the right ones are those recorded with the SuPerSense Surface system. Black and small square stands for the mean, the line flat inside the box (which comprises the 25~75% of distribution) is the median. Vertical line between dashes is the delimitation for the range within the 1.5 IQR (intra-quarter range). Green represents the patient group (PG), violet represents the elderly group (EG), and blue represents the young group (YG). For each group, the darkest colors are associated with the open-eyes condition (OE), while light colors are associated with the closed-eyes condition (CE).

