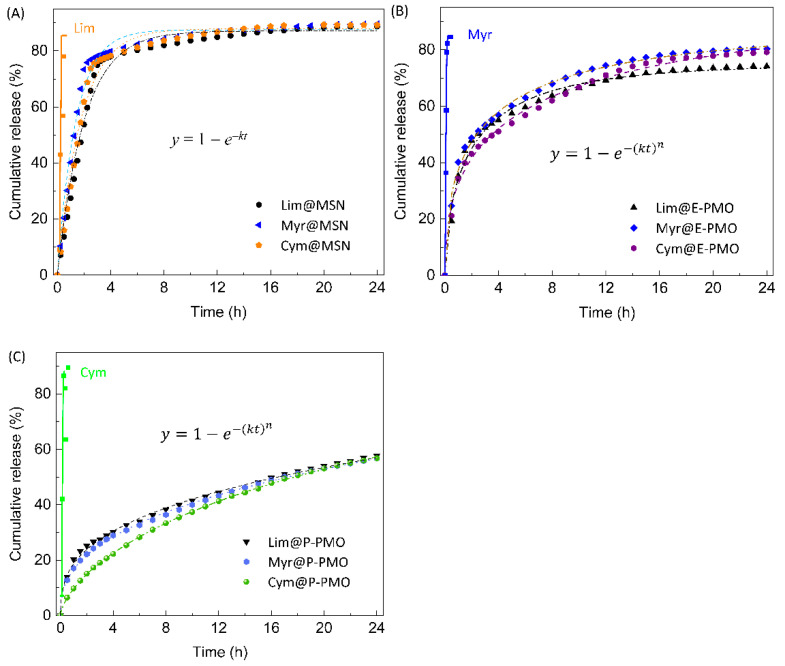
Figure 3.
Fragrance release curves (symbol) of nanocomposites based on (A) MSN, (B) E-PMO NPs, and (C) P-PMO NPs, as measured by TGA of the samples at 30 °C under a N2 flow of 1.0 mL min−1. Dashed lines represent the corresponding fits with the first-order kinetics (A) and Weibull models (B,C), where y is the fraction of the released fragrance to the total amount of fragrance at time t, k is the release rate constant, and n is the release exponent. The initial fragrance load of the composites was controlled in the range 36–40 wt%, achieved by soaking excess NPs (1 g) in a limited amount (0.5 mL) of fragrance during the preparation.

