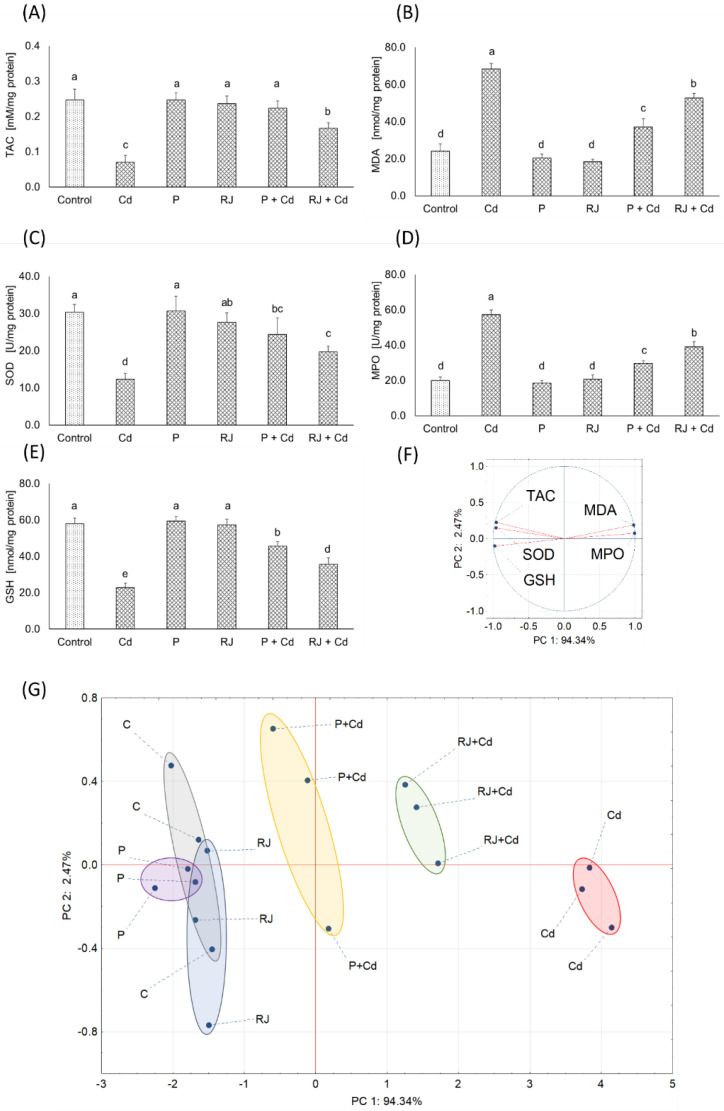
Figure 6.
Oxidative stress markers in females’ ovaries. (A) total antioxidant capacity (TAC); (B) malondialdehyde concentration (MDA); (C) superoxide dismutase (SOD) and (D) myeloperoxidase (MPO) activity; (E) reduced glutathione (GSH) concentration. (F) Principal component analysis (PCA) on oxidative stress markers variables, and (G) 2D PCA plot of control and experimental group cases. The same letters in each chart, a–e denotes homogenous groups (ANOVA; HSD Tukey test; p < 0.05). Shape colors in (G) denote: gray—Control group, violet—Propolis group, blue—Royal Jelly group, yellow—Cadmium + Propolis group, green—Cadmium + Royal Jelly group, red—Cadmium group.

