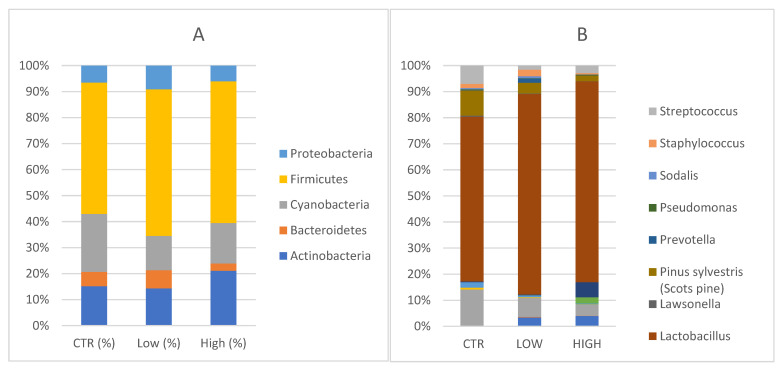
Figure 2.
(A) Phylum level: Relative abundance detected in endometrial samples. CTR = control; Low = HLA- DQ2/DQ8 negative-RPL; High= HLA-DQ2/DQ8 positive-RPL. (B) Genus level: Relative abundances detected in endometrial samples. Legenda: CTR = control; Low = HLA-DQ2/DQ8 negative-RPL; High: HLA-DQ2/DQ8 positive-RPL.

