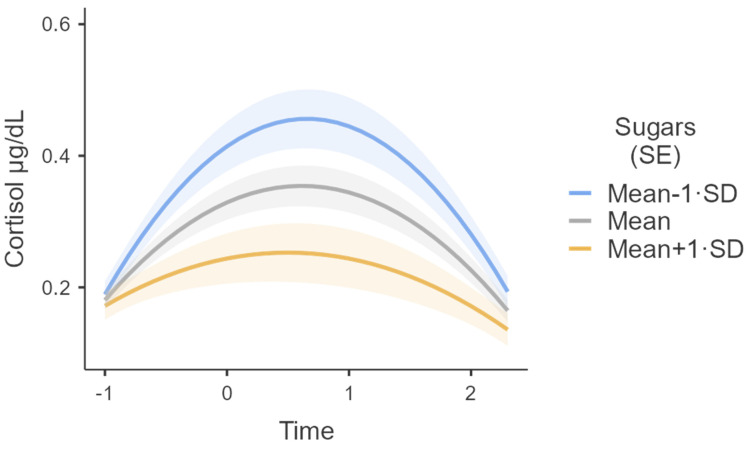
Figure 2.
Variability in cortisol response (µg/dL) over time for High (+1 SD), Mean and Low (−1 SD) levels of sugar consumption. Semi-transparent areas indicate Standard Errors. Time was coded as −1, 0, 0.75, and 2.25 following the original four points of measurements of baseline and 20, 35, and 65 min after the CPT.

