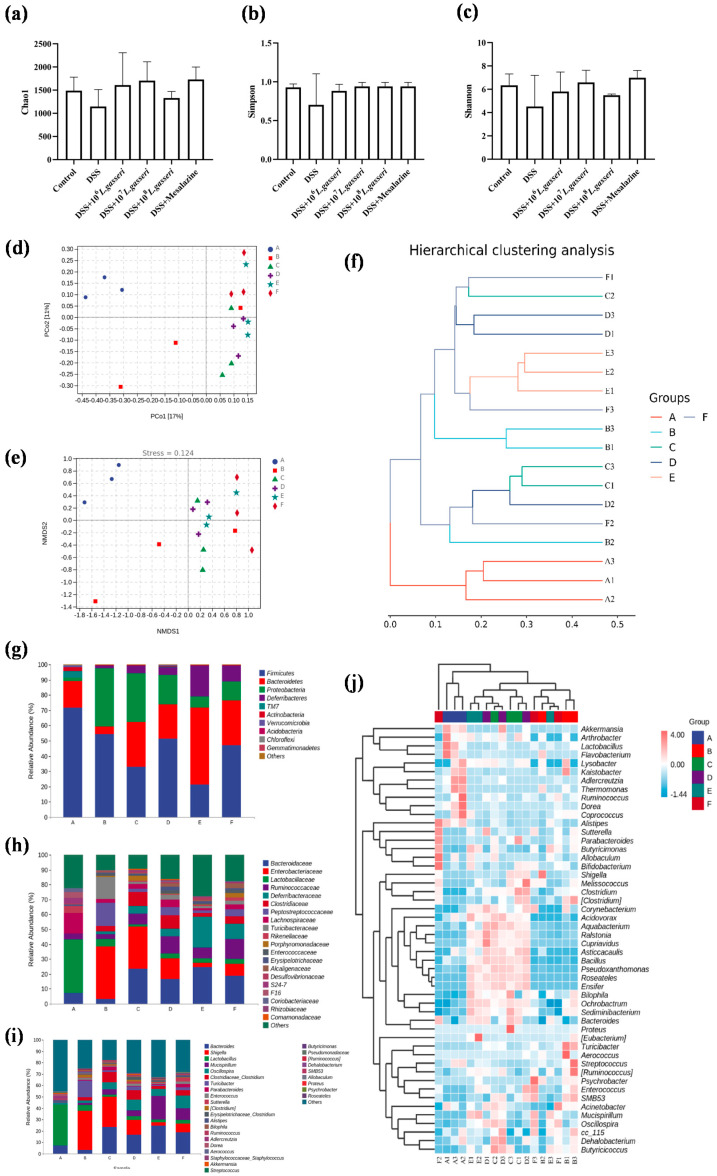
Figure 8.
Differences in intestinal microbiota composition among the six groups (n = 3). (a) Chao1 index, (b) Simpson Index, (c) Shannon Index, (d) PCoA analysis of groups, (e) NMDS analysis of groups, (f) UPGMA hierarchical clustering analysis of microbiology in groups, (g) microbial composition at the phylum level of the cecal contents, (h) microbial composition at the family level of the cecal contents, (i) microbial composition at the genus level of the cecal contents, and (j) heatmap of genus composition combined with cluster analysis at the genus level. A stands for control group, B for DSS group, C for DSS + 106 L. gasseri JM1 group, D for DSS + 107 L. gasseri JM1 group, E for DSS + 108 L. gasseri JM1 group, and F for DSS + mesalazine group.

