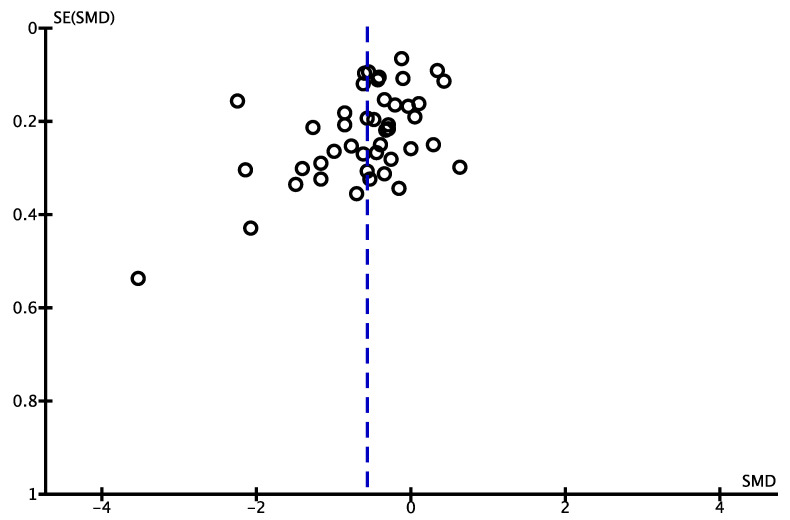
Figure 4.
Funnel plot for mean weight change comparing web-based interventions with offline control groups (n = 44). Each circle represents a study, and the vertical dashed line represents the pooled effect size. In the absence of a publication bias, the plot should look symmetric. SMD, standardized mean difference; SE, standard error.

