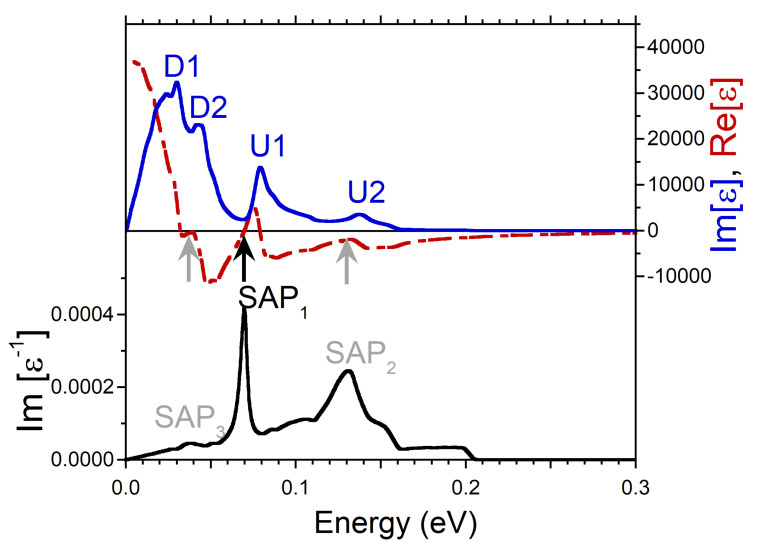
Figure 2.
Real (red dashed line) and imaginary (blue solid line) parts of dielectric function in Ni calculated at q = 0.027 Å pointing in the [100] symmetry direction and respective loss function, −Im, (black solid line). Four peaks in Im generated by the states marked in the DOS of Figure 1b,c are labeled by the respective symbols. The energy region where Re crosses with positive slope the zero line is marked by black arrow, whereas the regions where it approaches the zero line only are marked by gray arrows. In the loss function, a peak corresponding to a long-lived spin acoustic plasmon is marked as SAP. The strongly damped acoustic plasmon modes are denoted as SAP and SAP.

