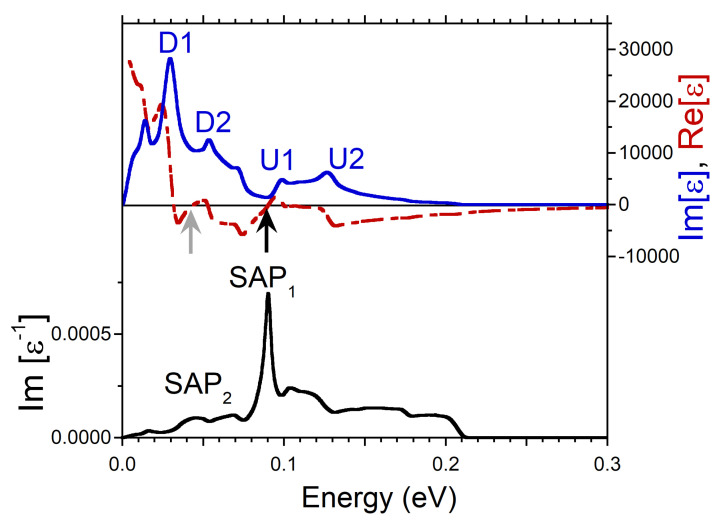
Figure 6.
Real (red dashed line) and imaginary (blue solid line) parts of dielectric function in Ni calculated at q = 0.038 Å pointing in [111] symmetry direction and respective loss function, −Im, (black solid line). Features in Im generated by the states marked in the DOS of Figure 1h,i are labeled by respective symbols. The energy regions where Re crosses the zero line with positive slope are marked by arrows. In the loss function a peak corresponding to a long-lived spin acoustic plasmon is marked as SAP. The overdamped acoustic plasmon peak is denoted as SAP.

