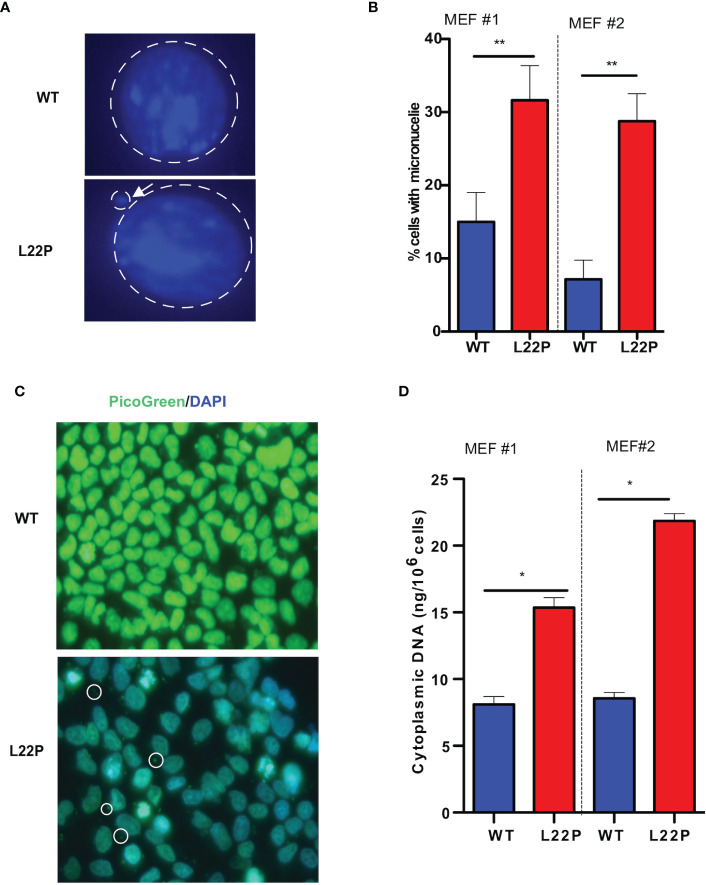
Figure 2.
Excessive DNA accumulates in the cytosol of POLB defective cells. (A) Representative image of micronuclei formation in dRP lyase proficient and deficient cells; (B) Percentage of cells positive for micronuclei; (C) Representative image of subcellular localization of cytosolic DNA (bold circle shows the cytosolic DNA, green represents Picogreen stained DNA, and blue represents nuclear DNA stained with DAPI); (D) Quantification of cytosolic double-strand DNA (dsDNA) in L22P versus WT cells. Two MEF cell lines (labeled as MEF #1 and MEF #2) were used to generate the data. Data were analyzed using a paired t-test in GraphPad Prism; P*<0.05, **P<0.01.

