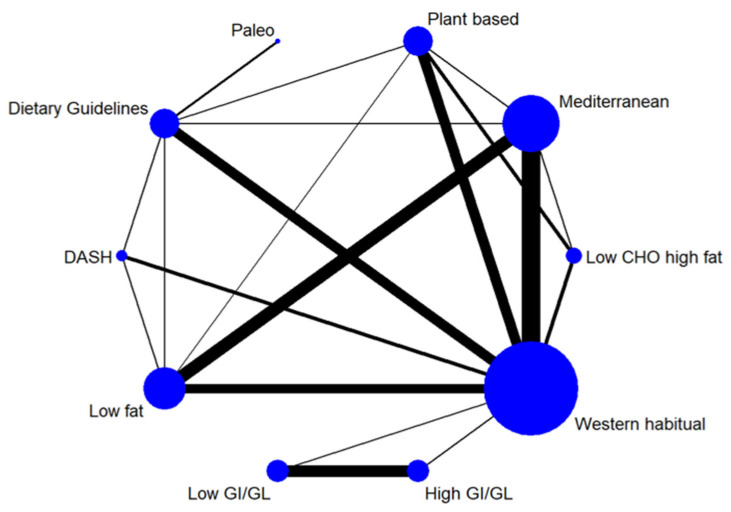
Figure 2.
Network diagram for LDL cholesterol illustrating the available direct comparisons between different dietary patterns. The size of the nodes is proportional to the sample size of each dietary pattern intervention, and the thickness of the lines is proportional to the number of studies available. The number of studies for each dietary pattern were: Mediterranean diet (n = 20); Dietary Approaches to Stop Hypertension (n = 5); Paleo diet (n = 2); Dietary guidelines-based diets (n = 12); low GI/GL diet (n = 9); plant-based diets (n = 10); low-fat diet (n = 14); low carbohydrate high-fat diet (n = 4); high GI/GL diet (n = 9); and western habitual diet (n = 37).

