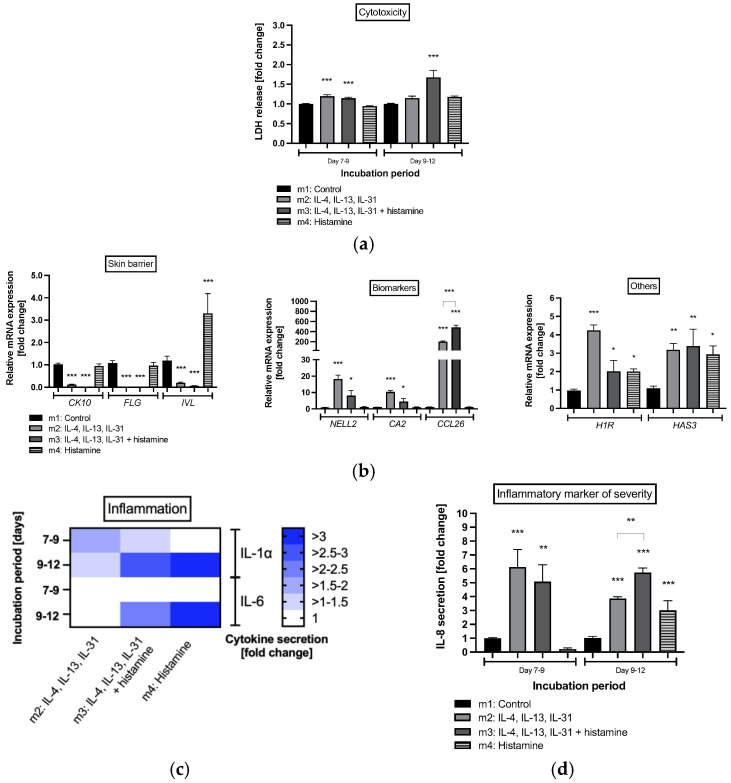
Figure 4.
(a) Cell viability, (b) gene expression profiles from healthy and atopic dermatitis full-thickness skin models after 12 days of cultivation to air surface (airlift), and (c) interleukin (IL)-1α, IL-6 and (d) IL-8 protein expression after days 7 to 9 and days 9 to 12 of cultivation to air surface (airlift). Atopic dermatitis skin models were stimulated with TH2 cytokines (50 ng/mL IL-4, 50 ng/mL IL-13, and 25 ng/mL IL-31) at days 0, 2, 5, 7 and 9 (m2, m3). Healthy skin model m4 and atopic dermatitis skin model m3 were stimulated with 10 µM histamine at day 9. Healthy skin models were cultivated under normal medium conditions (m1, m4). (a,c,d) All data are given as fold changes compared to the untreated control at the respective time points, after day 9 (incubation period days 7 to 9) and day 12 (incubation period days 9 to 12) of incubation. (b) Transcript levels are given as relative mRNA expression referred to the untreated control [fold changes]. (a,b,d) All data are presented as mean ± SEM. (c) All data in the heatmap are presented as mean. Two independent experiments were performed as replicates. Asterisks [*] indicate significant deviations from the control at the respective time point (* p < 0.05, ** p < 0.01 and *** p < 0.001).

