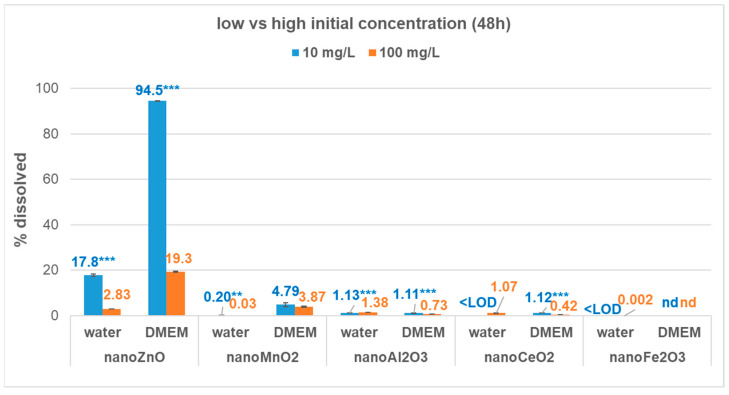
Figure 2.
Influence of initial concentrations (10 mg/L vs. 100 mg/L) on % solubility of the ZnO, MnO2, CeO2, Al2O3, and Fe2O3 ENMs in water and DMEM after 48 h of incubation (<LOD = below the limit of detection; nd = not detected). Results are presented as mean (standard deviation) of triplicates, and pH values are reported in Table S5A. For a given metal-oxide and medium, ‘**’ and ‘***’ indicate significant differences between 10 vs. 100 mg/L at α = 0.01 and 0.001, respectively, based on the Student’s t-test. See Figure S2 in the Supplementary Materials for absolute mass dissolved in water and DMEM.

