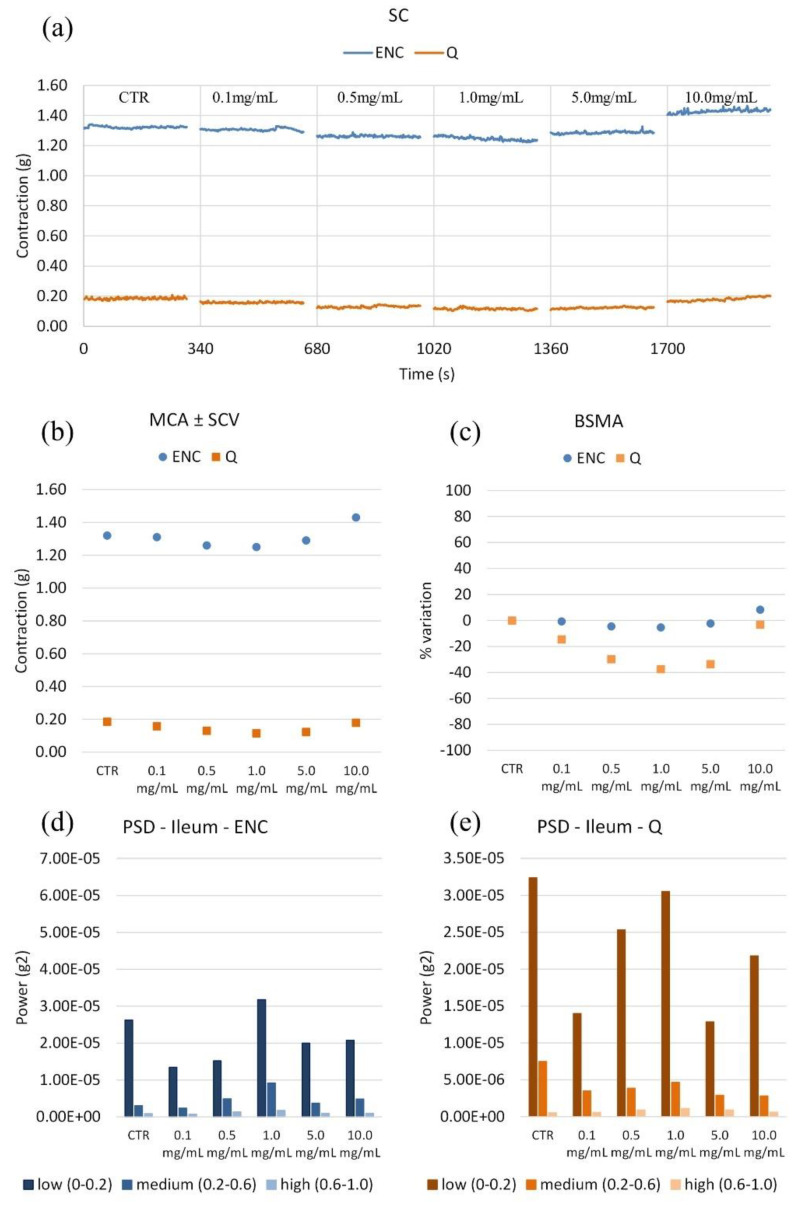
Figure 5.
(a) Experimental original recording of the concentration–response curve of ENC (Castanea sativa Mill.) and Q (Schinopsis balansae Engl.) extract on ileum spontaneous contractility (SC). (b) Mean contraction amplitude (MCA) with spontaneous contraction variability (SCV). (c) Basal Spontaneous Motor Activity (BSMA). Zero represents the basal tone, and each point is the percent variation from the baseline after cumulative addition of each dose; each value is the mean ± SEM; when the error bar is not shown, it is covered by the point. (c) Power Spectral Density (PSD): (d) Ileum with ENC; (e) Ileum with Q.

