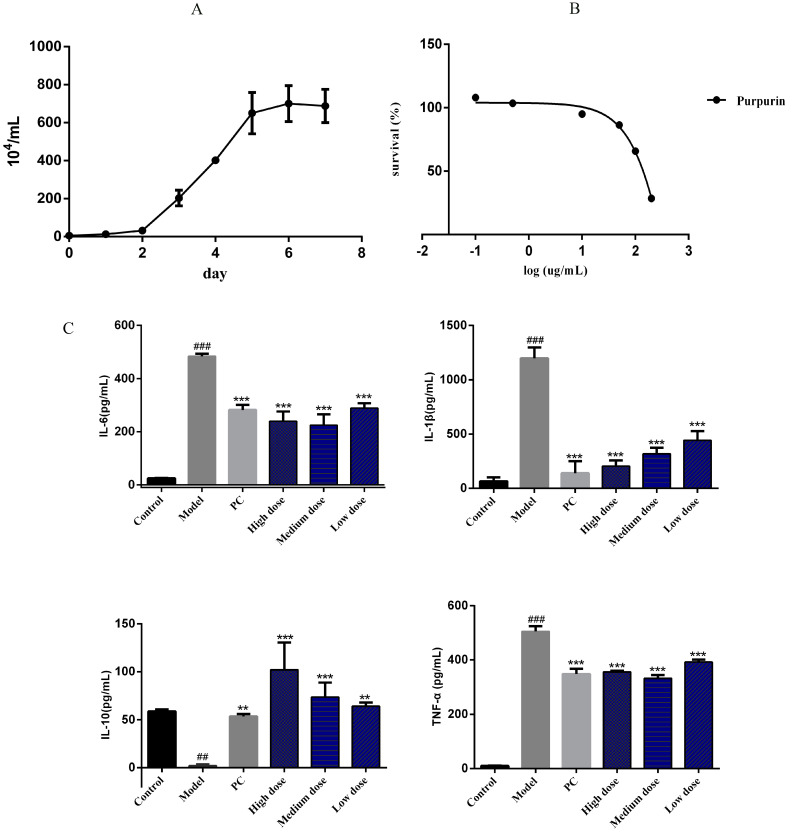
Figure 2.
The effect of purpurin on inflammatory factors. (A) The growth curve of RAW 264.7 cells, n = 3. (B) Assessment of purpurin cytotoxicity using MTT assay. The tested concentrations of purpurin were 200, 100, 50, 10, 0.5, and 0.1 μg/mL, respectively, n = 3. (C) The anti-inflammatory effect of purpurin, the purpurin concentrations in the high-, medium-, and low-dose groups were 1, 0.5, and 0.1 μg/mL, respectively. Model: LPS group, PC: positive control group. Data are represented as mean ± SD. ### p < 0.001, ## p < 0.01 vs. control. *** p < 0.001, ** p < 0.01 vs. model.

