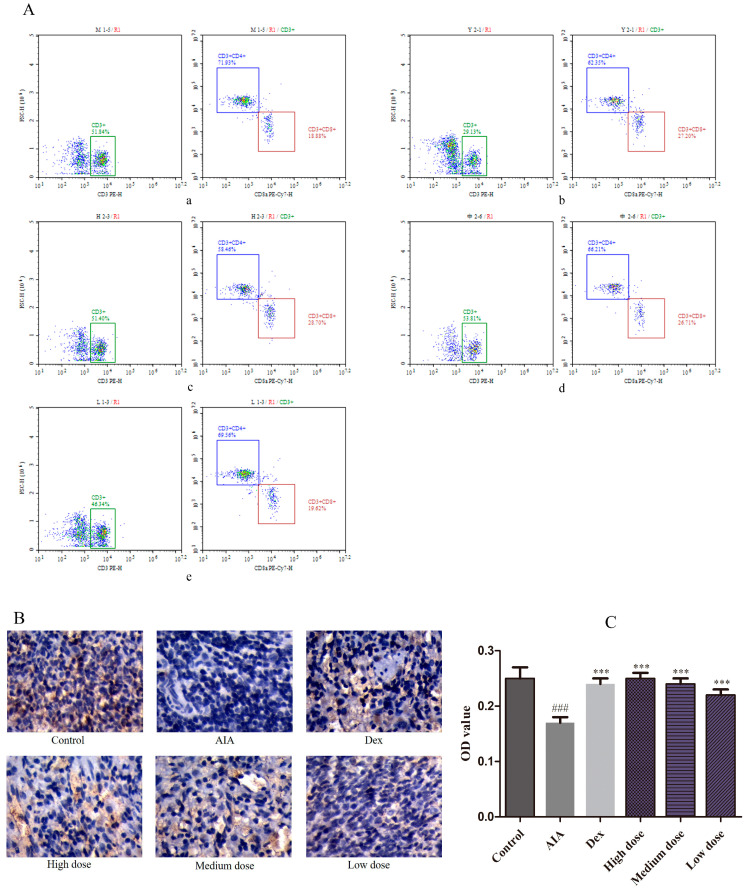
Figure 5.
Effects of purpurin on CD4+ and CD8+ T cells, and FOXP3 contents. (A) The ratio of CD4+/CD8+ estimated using flow cytometry. (a) AIA group, (b) Dex group, (c) high-dose purpurin group, (d) medium-dose purpurin group, and (e) low-dose purpurin group. (B) Immunohistochemical staining of FOXP3 in the spleen tissue of rats in each group (magnification: 100-fold). (C) The optical density (OD) value of each group. Dex: dexamethasone; AIA: adjuvant-induced arthritis; Data are represented as mean ± SD. ### p < 0.001 vs. control, *** p < 0.001 vs. model, n = 6 in each group.

