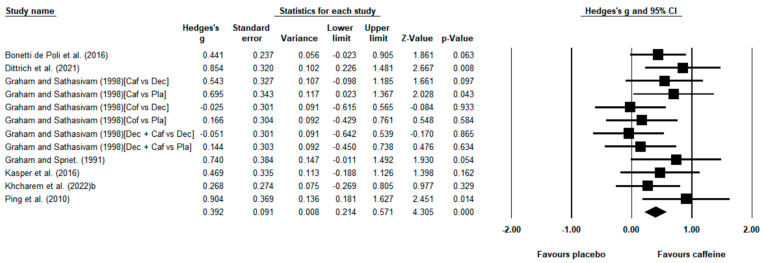
Figure 3.
Effect of caffeine ingestion as compared to placebo on time to exhaustion runs. The forest plot shows standardized mean differences with 95% confidence intervals (CI) for 12 unique placebo–caffeine comparisons in 7 studies [43,44,45,46,47,49,51]. The diamond at the bottom of the graph represents the pooled standardized mean difference following random effects meta-analyses. A positive value reflects an increase in the time to exhaustion with caffeine with respect to the placebo. The size of the plotted squares reflects the relative statistical weight of each study. Caf, caffeine; Dec, decaffeinated coffee; Pla, placebo.

