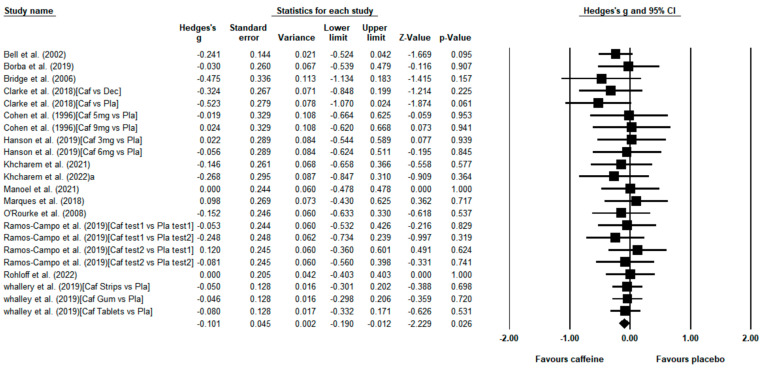
Figure 4.
Effect of caffeine ingestion as compared to placebo on endurance running time trials. The forest plot shows standardized mean differences with 95% confidence intervals (CI) for 22 unique placebo–caffeine comparisons in 14 studies [7,23,24,25,26,30,34,35,42,48,50,52,53,54]. The diamond at the bottom of the graph represents the pooled standardized mean difference following random effects meta-analyses. A negative value reflects a reduction in the time employed to complete a given distance with caffeine with respect to the placebo. The size of the plotted squares reflects the relative statistical weight of each study. Caf, caffeine; Dec, decaffeinated coffee; Pla, placebo.

