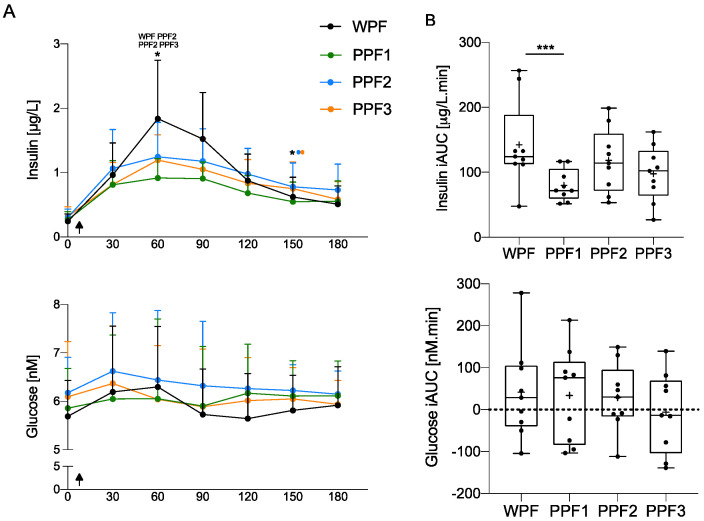
Figure 5.
Insulin, but not glucose, plasma concentrations (A) over time (min), and (B) their iAUC, showed a significantly different response post-WPF than PPF 1, 2, or 3 meals. Values are mean ± SD (n = 9). Arrows indicate the ingestion of the meal. Concentration over time data were assessed by 2-way repeated measurements (time × treatment) ANOVA, and iAUC was compared with a 1-way repeated measures (treatment) ANOVA. Significant at p < 0.05 (*), p or p < 0.001 (***). The products’ names above the asterisk indicate the treatments in which postprandial insulin concentrations significantly differ at that time. iAUC, incremental area under the curve; PPF, plant protein fibre; WPF, whey protein fibre.

