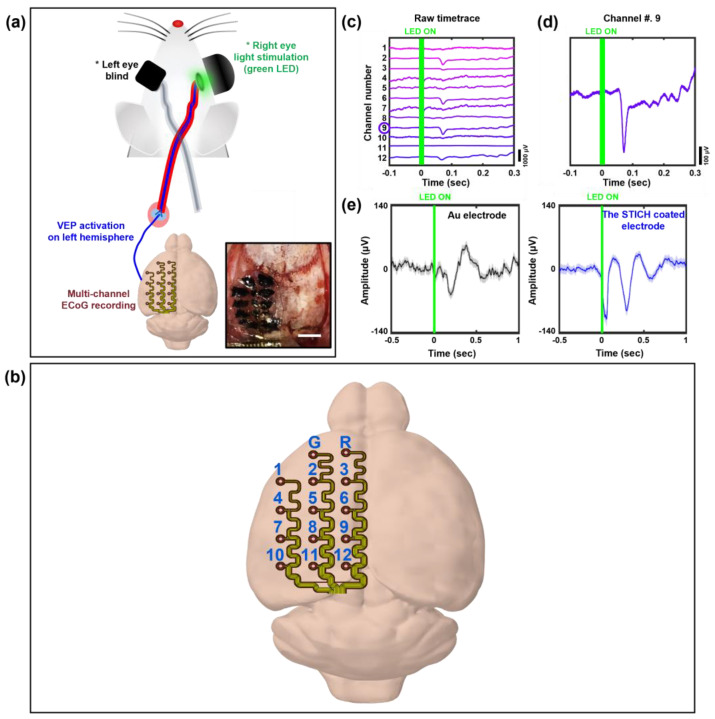
Figure 6.
Experimental results of the acute in vivo ECoG monitoring and VEP activation tests conducted using an anesthetized rodent model. (a) Schematic of ECoG monitoring during VEP activation on the left hemisphere of a rat by stimulating its right eye using a green LED (inset: a photograph of the STICH-coated stretchable surface electrode arrays mounted on the left hemispheric cortex, the scale bar indicates 3 mm). (b) Two-dimensional deployment map of the multi-channel ECoG electrodes mounted on the rodent’s cortex. (c) Representative raw plot of the baseline ECoG and VEP signals recorded using the multi-channel surface electrode arrays. (d) An activated VEP signal recorded from a representative channel. (e) Average VEP plot derived from 140 trials of light stimulation tests. The difference in amplitude of the average VEPs before (left) and after (right) the STICH coating demonstrates the significant contribution of the STICH in improving the neural recording performance of the electrodes.

