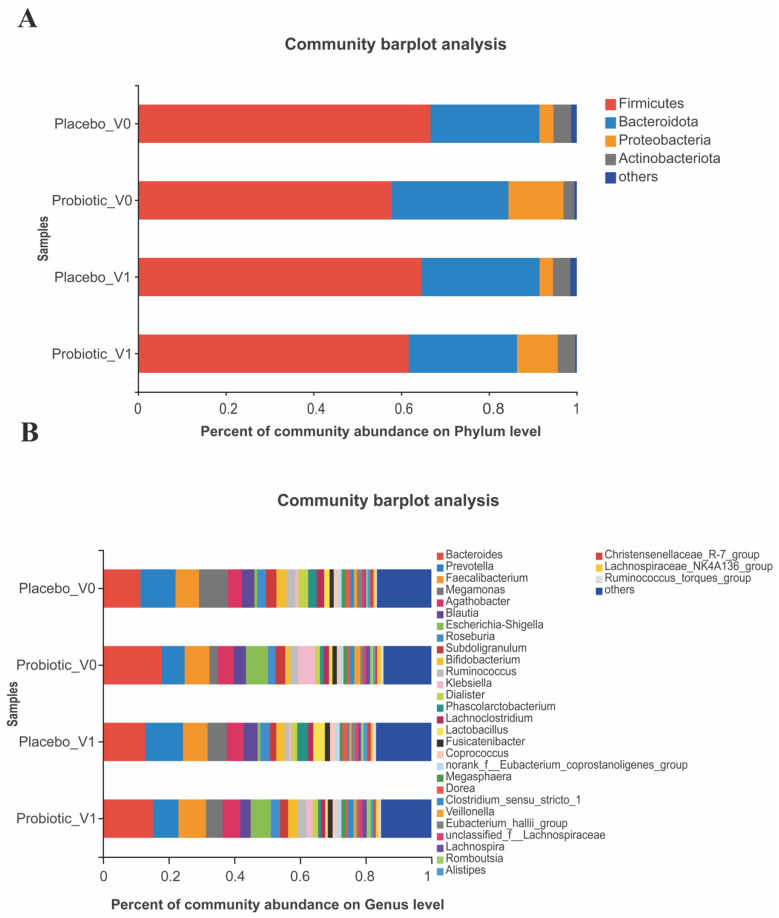
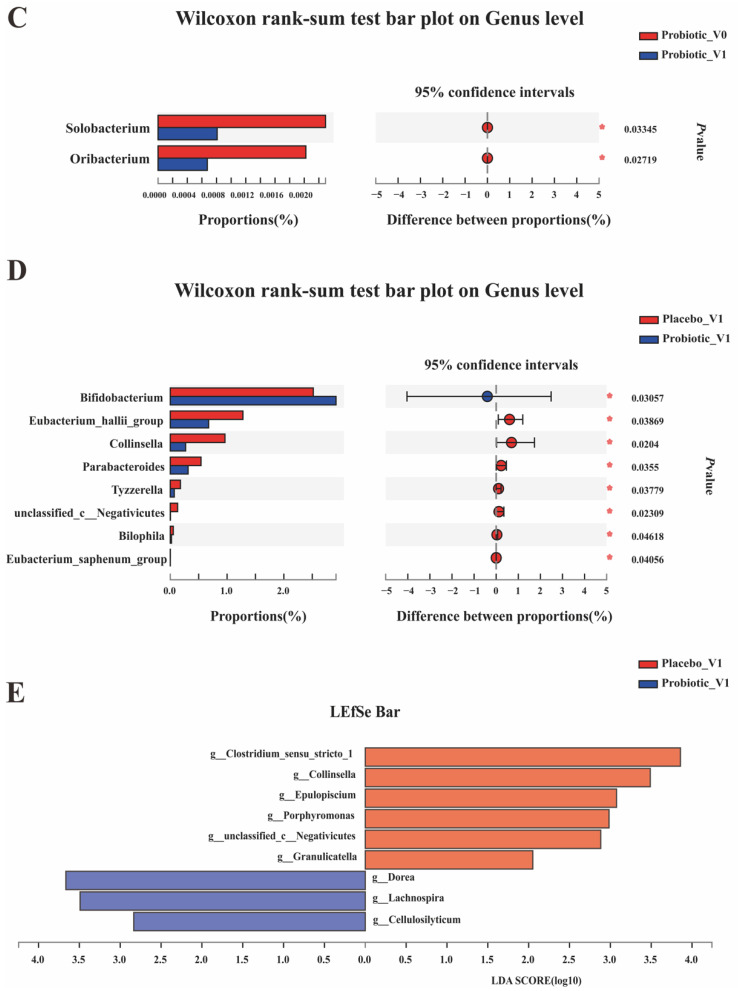
Figure 5.
Effects of BB68S intervention on the composition of the gut microbiota. (A) Relative abundances of main phyla between groups. (B) Relative abundances of main genera ≥1% between groups. (C) Significantly different genera levels after intervention in the BB68S group. (D) Significantly different genera levels between 2 groups after intervention. (E) LEfSe analysis indicated significant differences between the 2 groups after intervention. * p ≤ 0.05. Placebo_V0: samples of the placebo group at baseline, Probiotic_V0: samples of the probiotic group at baseline, Placebo_V1: samples of the placebo group after intervention, Probiotic_V1: samples of the BB68S group after intervention.


