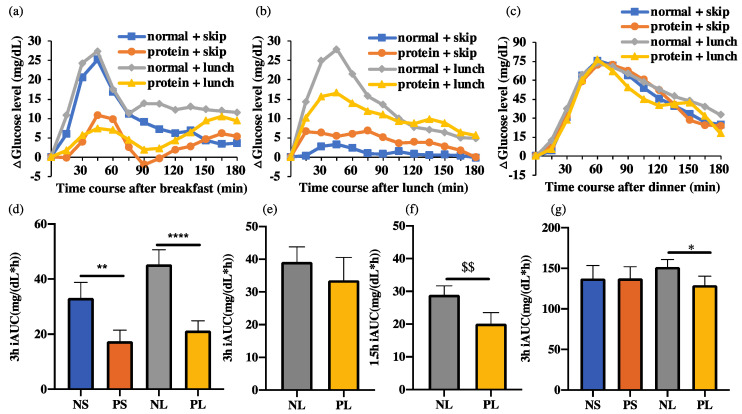
Figure 5.
ΔGlucose levels 3 h after each meal and iAUC. Data are shown as mean ± SEM; iAUC, incremental area under the curve. NS, normal + skip; PS, protein + skip; NL, normal + lunch; PL, protein + lunch. (a) ΔGlucose levels 3 h after breakfast. (b) ΔGlucose levels 3 h after lunch. (c) ΔGlucose levels 3 h after dinner. (d) 3 h iAUC at breakfast. (e) 3 h iAUC at lunch. (f) 1.5 h iAUC at lunch. $$ p < 0.01, Wilcoxon matched-pairs signed rank test (g) 3 h iAUC at dinner. * p < 0.05, ** p < 0.01, **** p < 0.0001, two-way repeated ANOVA, Sidak.

