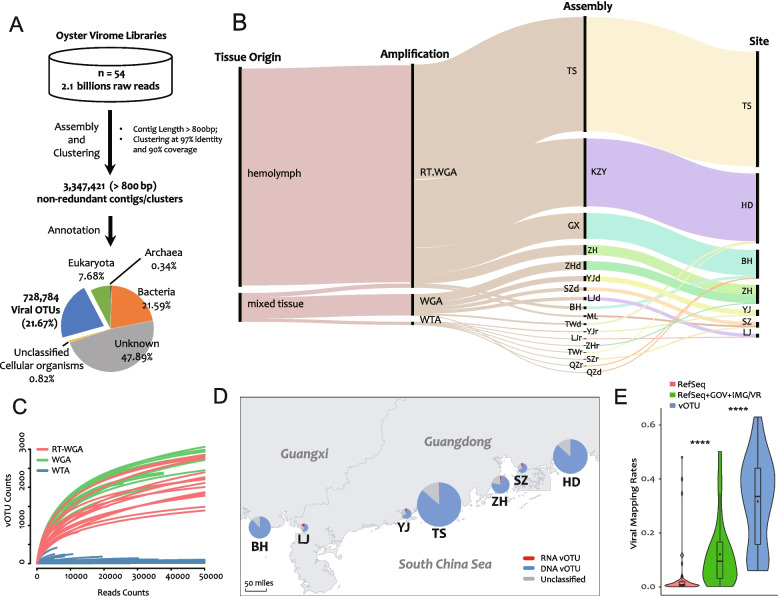
Fig. 1.
Overview of the Dataset of Oyster Virome (DOV). A De novo assembly and annotation pipeline. B Sankey diagram of the relationship among different batches and groups. The heights of the black vertical bars proportionally represent the number of viral contigs (vOTUs) assembled under the each group. C Rarefaction curves of the oyster viromic libraries. RT-WGA, reverse transcription and whole genome amplification; WGA, whole genome amplification; WTA whole transcriptome amplification. D Sampling site distribution map and the number of detected vOTUs from each site. The radius of the pie chart indicates the number of DNA, RNA, and unclassified vOTUs. E Mapping rates of viral reads in total clean reads. RefSeq, NCBI viral RefSeq genomes (release March 2021); GOV (release July 2020), Global Ocean Virome dataset; IMG/VR (release January 2018), a database of cultured and uncultured DNA viruses and retroviruses maintained by the Joint Genome Institute; vOTU, de novo assembled vOTUs in the DOV. “****” indicates p < 0.0001 (Student’s t-test between the three mapping rates)

