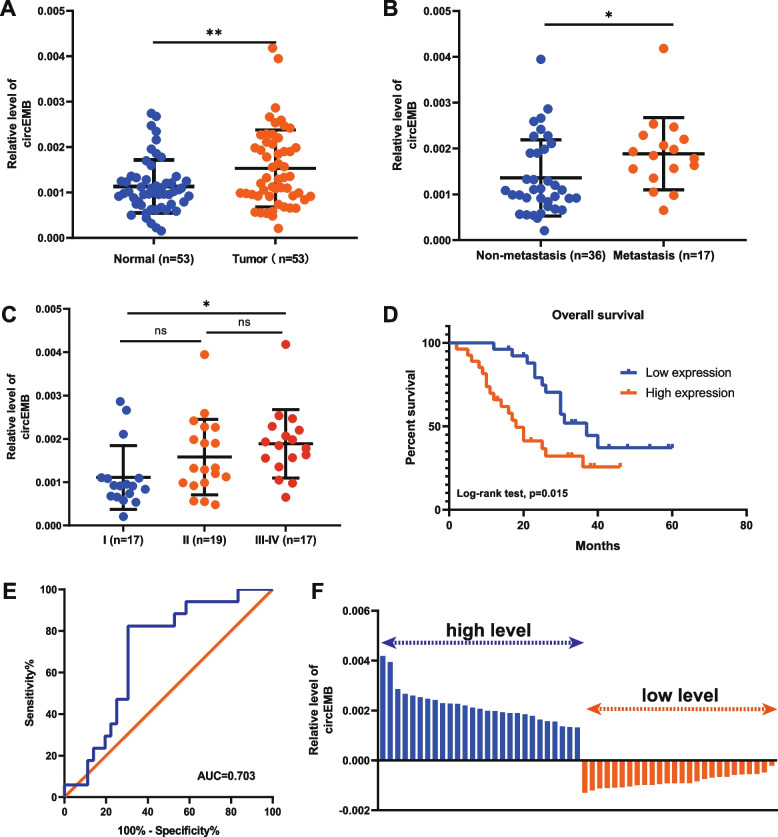
Fig. 2.
Correlation between circEMB expression and clinical characteristics of patients with OSA. a Differential expression of circEMB in OSA tissues and matched adjacent normal tissues. b Correlation of circEMB with OSA metastasis. c Distribution of circEMB expression in the TNM stage of OSA. d Kaplan–Meier analysis indicated that high circEMB expression was correlated with a worse prognosis. e ROC curve showing the capability of circEMB in distinguishing patients with metastasis. f Based on the median circEMB expression, patients with OSA (n = 53) were divided into two groups (high- and low-circEMB-expression groups). Data are expressed as mean ± SD (n = 3) (*, p < 0.05; **, p < 0.01; ***, p < 0.001)

