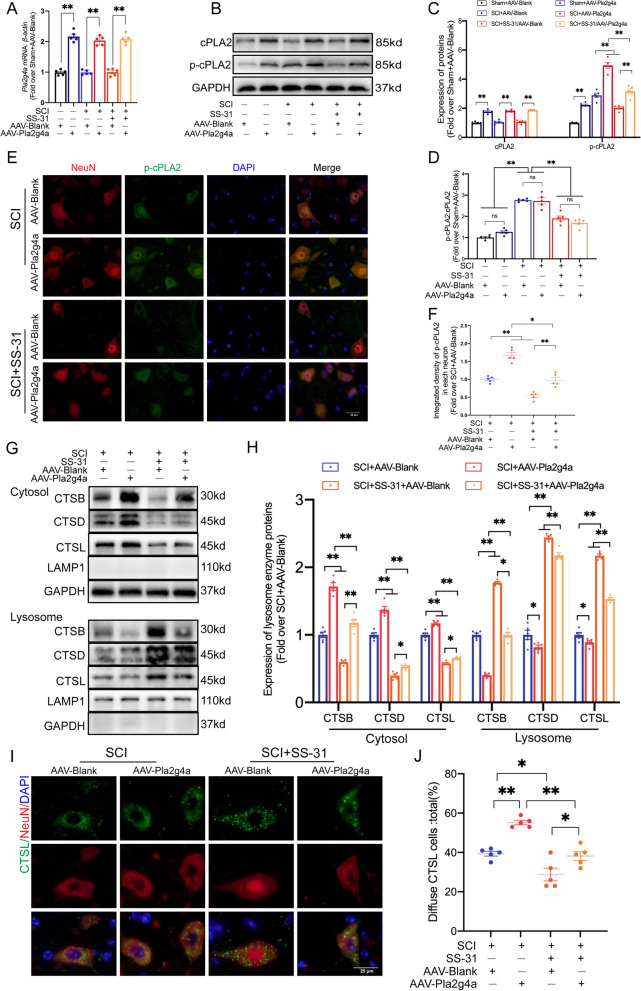
Fig. 6.
SS-31 inhibits LMP by downregulating cPLA2. A mRNA level of Pla2g4a gene in the impaired spinal cords of the Sham + AAV-Blank, Sham + AAV-Pla2g4a, SCI + AAV-Blank, SCI + AAV-Pla2g4a, SCI + SS-31 + AAV-Blank, and SCI + SS-31 + AAV-Pla2g4a groups at 3 dpi. B–D WB analysis of cPLA2 and p-cPLA2 expression in the injured spinal cord lesions in the six groups. The protein levels of p-cPLA2 and total cPLA2 and the ratio were quantified in the injured spinal cord. E–F Representative IF images of p-cPLA2 and NeuN in the impaired spinal cord areas from the SCI + AAV-Blank, SCI + AAV-Pla2g4a, SCI + SS-31 + AAV-Blank, and SCI + SS-31 + AAV-Pla2g4a groups at 3 dpi (scale bar = 25 μm). The quantification data are shown on the right. G CTSB, CTSD, and CTSL protein concentrations were extracted in the cytoplasm and lysosomes from the spinal cords of the indicated four groups. H Quantification of the protein levels of CTSB, CTSD and CTSL in the cytoplasm and lysosomes extracted from the spinal cord. I IF staining of NeuN and CTSL in the anterior horns of the spinal cords from the SCI + AAV-Blank, SCI + AAV-Pla2g4a, SCI + SS-31 + AAV-Blank, and SCI + SS-31 + AAV-Pla2g4a groups on postoperative day 3 (scale bar = 25 μm). J Comparison of the ratio of diffuse CTSL cells in the anterior horn of the spinal cord among the four groups. The data are shown as the mean ± SEM. n = 5. *P < 0.05, **P < 0.01. ns indicates no significance

