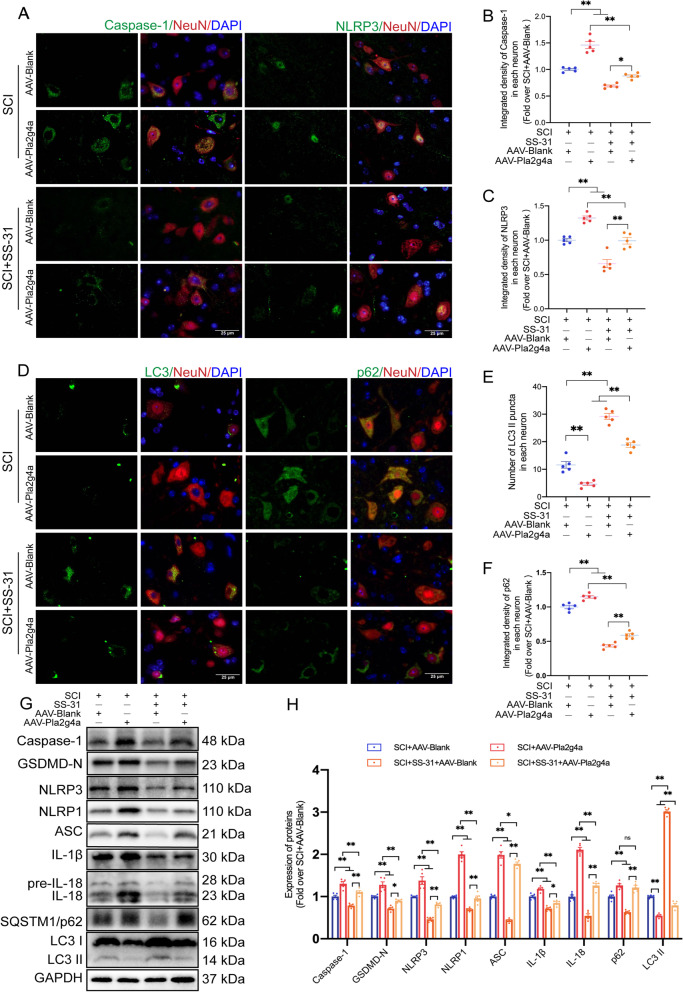
Fig. 7.
SS-31 inhibits pyroptosis and enhances autophagy by downregulating cPLA2. A–C Representative double-IF images for Caspase-1/NeuN and NLRP3/NeuN in spinal cord lesions from all groups (SCI + AAV-Blank, SCI + AAV-Pla2g4a, SCI + SS-31 + AAV-Blank, SCI + SS-31 + AAV-Pla2g4a groups) at 3 dpi (scale bar = 25 μm). The quantitative integrated density of Caspase-1 and NLRP3 in each neuron is shown on the graph. D–F Representative double-IF images for LC3/NeuN and p62/NeuN in spinal cord lesions from all groups (the SCI + AAV-Blank, SCI + AAV-Pla2g4a, SCI + SS-31 + AAV-Blank, SCI + SS-31 + AAV-Pla2g4a groups) at 3 dpi (scale bar = 25 μm). The number of LC3 II puncta and the quantitative integrated density of p62 in each neuron is shown on the graph. G Typical images of WB analyses of Caspase-1, GSDMD-N, NLRP3, NLRP1, ASC, IL-1β, IL-18, p62, and LC3 II in the impaired spinal cord. GAPDH was utilized as a loading control. H Quantification results of the related protein levels in the indicated groups. The data are shown as the mean ± SEM. n = 5. *P < 0.05, **P < 0.01. ns indicates no significance

