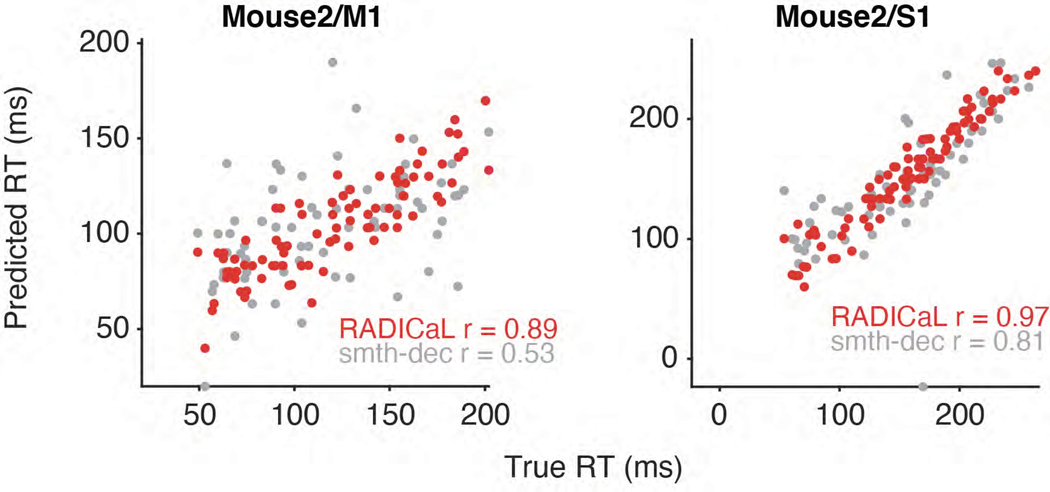
Extended Data Fig. 8. Prediction of single-trial reaction times for additional mouse water grab experiments.
This figure is like Figure 4d, for the remaining datasets. Each dot represents an individual trial, color-coded by the technique. Correlation coefficient r was computed between the true and predicted reaction times. Data from Mouse2/M1 (left) and Mouse2/S1 (right).

