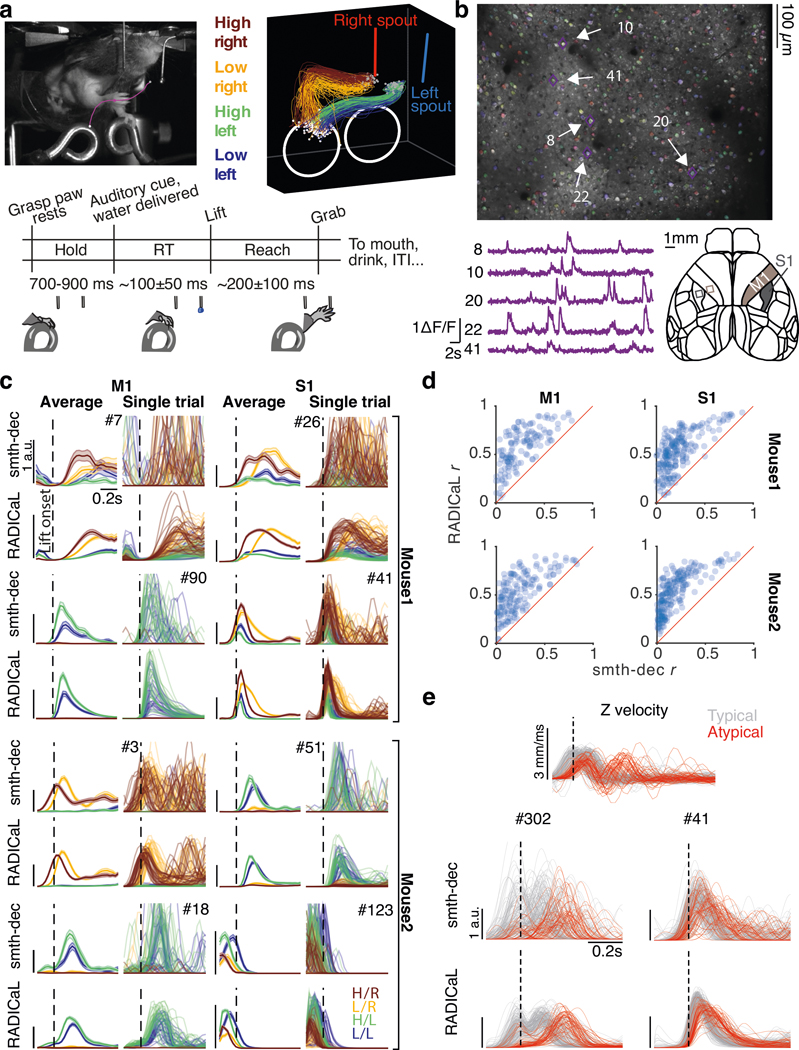
Figure 3 |. Application of RADICaL to real two-photon calcium imaging of a water grab task.
(a) Task. Top left: Mouse performing the water grab task. Pink trace shows paw centroid trajectory. Bottom: Event sequence/task timing. RT: reaction time. ITI: inter-trial interval. Top right: Individual reaches colored by subgroup identity. (b) Top: an example field of view (FOV), identified neurons colored randomly. Bottom left: dF/F from a single trial for 5 example neurons. Bottom right: Allen Atlas M1/S1 brain regions imaged. (c) Comparison of trial-averaged (left) and single-trial (right) rates for 8 individual neurons for two different brain areas (left vs. right) and two different mice (top half vs. bottom half) for smth-dec and RADICaL (alternating rows). Left: each trace represents a different reach subgroup (4 in total) with error bars indicating s.e.m. Right: each trace represents an individual trial (same color scheme as trial-averaged panels). Odd rows: smth-dec event rates (Gaussian kernel: 40 ms s.d.). Even rows: RADICaL-inferred event rates. Horizontal scale bar represents 200 ms. Vertical scale bar denotes event rate (a.u.). Vertical dashed line denotes lift onset time. (d) Performance of RADICaL and smth-dec in capturing the empirical PSTHs on single trials. Correlation coefficient r was computed between the inferred single-trial event rates and empirical PSTHs. Each point represents an individual neuron. (e) Kinematic profiles and neural representations of atypical trials. Top: Z-dimension of hand velocity profile. Each trace represents an individual trial, colored by typical vs. atypical. Atypical trials are identified as the trials that have a second peak in Z-dimension of the hand velocity that is larger than 50% of the first peak. Middle and Bottom: Comparison of single-trial rates for 2 example neurons (data from Mouse1/S1) for smth-dec (middle row) and RADICaL (bottom row). Each trace represents an individual trial (same color scheme as top row). Horizontal scale bar represents 200 ms. Vertical scale bar denotes event rate (a.u.). Vertical dashed line denotes lift onset time.

