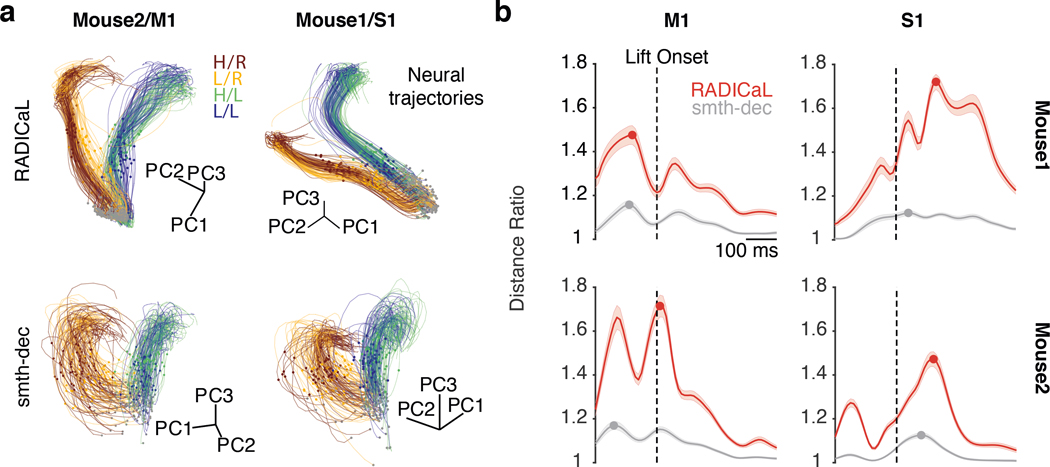
Figure 4 |. RADICaL produces neural trajectories reflecting trial subgroup identity in an unsupervised manner.
(a) Single-trial neural trajectories derived from RADICaL rates (top row) and smth-dec rates (bottom row) for two experiments (left: Mouse2/M1; right: Mouse1/S1), colored by subgroups. Each trajectory is an individual trial, plotting from 200 ms before to 400 ms after lift onset. Lift onset times are indicated by the dots in the same colors with the trajectories. Grey dots indicate 200 ms prior to lift onset time. Neural trajectories from additional experiments are shown in Extended Data Fig. 6. (b) Performance of RADICaL and smth-dec in revealing distinct subgroups in single-trial neural trajectories. The ratio of the cross-group distance to the within-group distance was computed for each individual time point in a window from 200 ms before to 400 ms after lift onset. Horizontal scale bar represents 100 ms. Vertical dashed line denotes lift onset time. Error bar indicates the s.e.m. across individual trials. Dots indicate the maximum ratio for each method.

