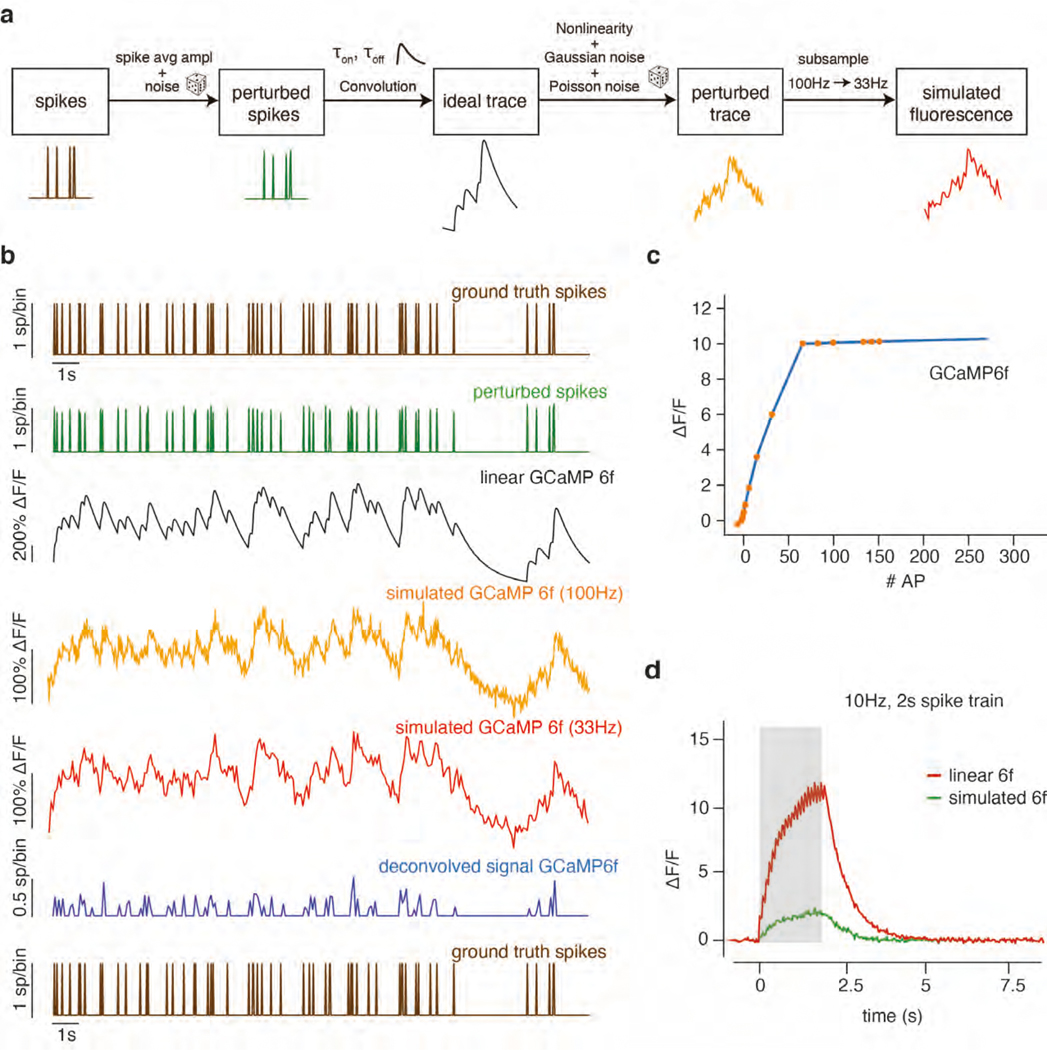
Extended Data Fig. 2. Simulation pipeline to generate artificial fluorescence traces from the underlying Lorenz system.
(a) This pipeline begins from the Poisson-random spikes generated in the far-right panel of Supplementary Figure 1. Calcium traces were generated by first corrupting the spikes with amplitude noise, then modeling the dynamics of calcium indicators in response to a spike with an autoregressive process of order 2 transformed by a piecewise-linear non-linearity. Sources of noise corrupting this fluorescence trace were then added. The nonlinearity and noise sources were chosen to approximate the variability observed in real data. (b) Example ground truth and simulated data using a GCaMP6f model. From top to bottom: original ground truth spikes fed into the simulator, perturbed spikes, idealized calcium trace, fluorescence trace with nonlinearity and noise sources added, fluorescence trace after subsampling, deconvolved spikes, and finally original ground truth spikes fed into the simulator (shown again for comparison; same as top). (c) Estimated nonlinearities for GCaMP6f from ref. 58. (d) Example traces generated by the simulator for a train of 10 Hz stimuli, with and without nonlinearity applied.

