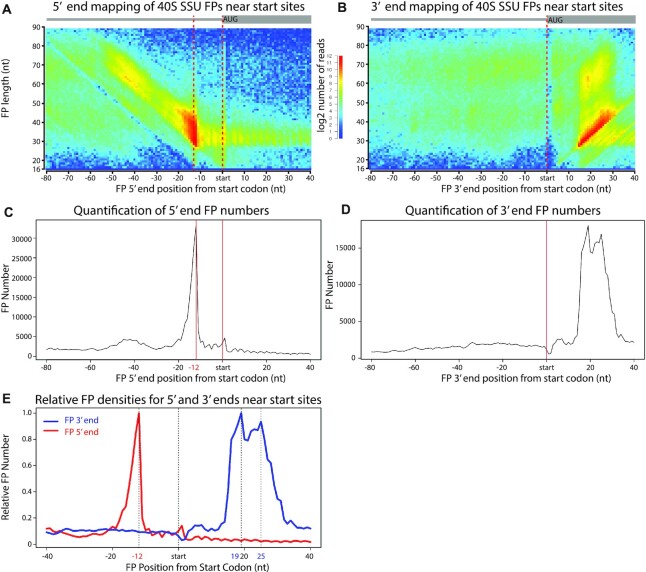
Figure 2.
TCP-seq of 40s complexes. (A) Metagene heatmap showing the relationship between FP length and FP location around the aligned initiation sites for 40S libraries. The distance between the 5′ end of the FP and the start codon is plotted. The colours indicate the number of FPs. (B) As in (A), but the distance to the 3′ end of the FP is plotted. (C) Projection of the data in (A) along the x-axis. (D) Projection of the data in (B) along the x-axis. (E) Data for (C) and (D) plotted on the same graph to facilitate their comparison.

