Figure 6.
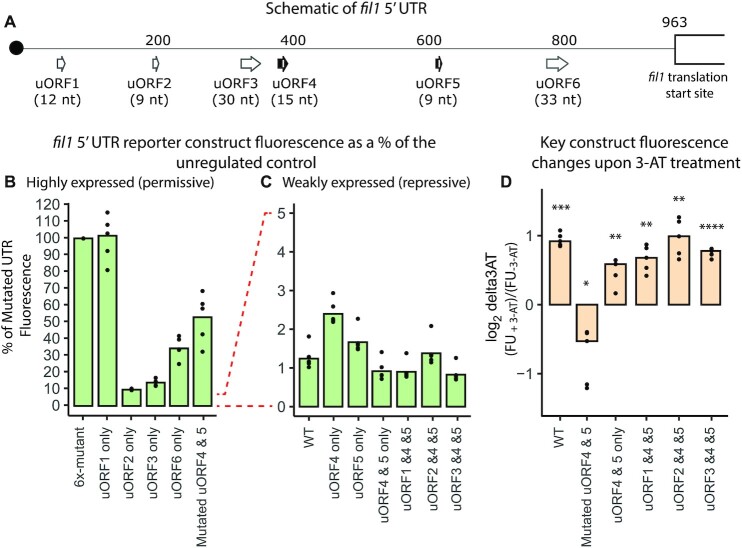
Reporter analysis of the fil1 5′ UTR. (A) Schematic of the fil1 5′ UTR showing the location and length of six uORFs. (B) Fluorescence levels of reporters containing highly-expressed versions of the fil1 5′ UTR in the absence of 3-AT. Data have been normalised to the fluorescence levels of the construct with all uORFs mutated (100%, 6x-mutant). (C) As in B, but showing the data from weakly-expressed constructs in the absence of 3-AT. Data normalised as in (B). (D) Changes in fluorescence reporter levels expressed as the ratio between 3-AT-treated and untreated control cells (log2-transformed). Data are from five independent biological replicates (dots represent the values from each experiment and bars show the corresponding means. Statistical significance was determined using paired t-tests: * P ≤ 0.05; ** P ≤ 0.01; *** P ≤ 0.001; **** P ≤ 0.0001.

