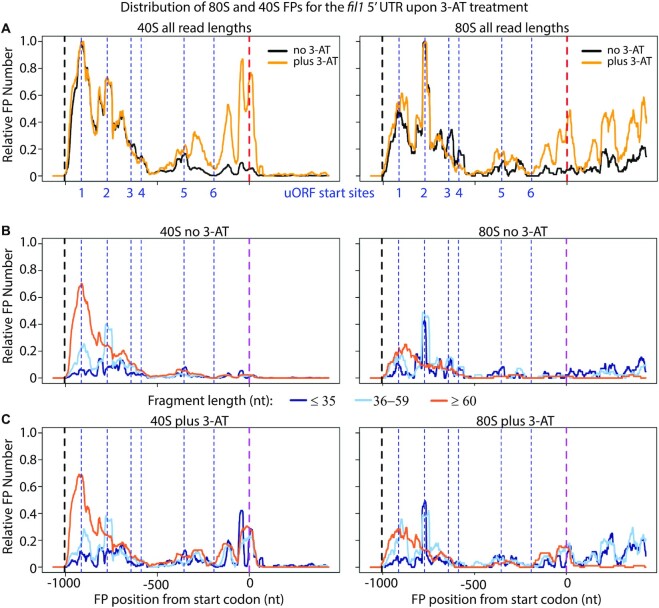
Figure 7.
Distribution of 80S and 40S FPs on the fil1 gene upon 3-AT treatment. (A) Normalised FP densities for the fil1 mRNA at the 5′ UTR and translation initiation sites. X-axis: distance to the initiation codon; transcription start sites (black dashed lines); translation initiation sites for main coding sequence (dashed red lines); uORFs (dotted blue lines); uORF1 starts with CUG and uORF 2–6 with AUG. y-axis: relative FP number, obtained by normalising 80S/40S FP numbers by their corresponding maximum value. Cells were untreated with 3-AT (black) or treated (yellow). (B) As in (A), but with data segmented by length; translation initiation sites for main coding sequence (dashed purple line). FP length ≤35 nucleotides (dark blue), FP length 36–59 (light blue), FP length ≥60 (orange). Note the whole length of the FPs is plotted (cf. Figures 1 and 2 where only 5′/3′ ends are shown). All data are for replicate 2. (C) As in (B), but for 3-AT-treated cells.

