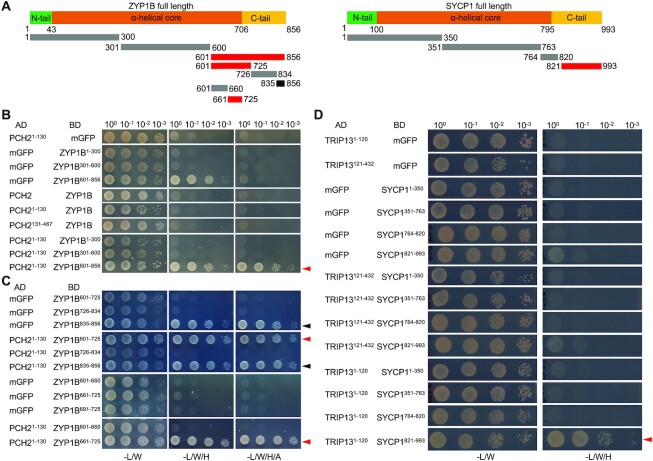
Figure 3.
PCH2/TRIP13 interacts with ZYP1/SYCP1. (A) Schematic graph of Arabidopsis ZYP1B and mouse SYCP1 showing the central α-helical core domain flanked by the unstructured N- and C-terminal tails. The lines below indicate the truncations used in the yeast two-hybrid interaction assay. Red lines indicate the positive interaction and black line indicates the autoactivation. (B–D) Yeast two-hybrid assay of PCH2 and ZYP1 (B and C) or TRIP13 and SYCP1 (D) with different truncations. Red and black arrowheads indicate positive interaction and autoactivation, respectively.

